Unlock a world of possibilities! Login now and discover the exclusive benefits awaiting you.

- Qlik Community
- :
- All Forums
- :
- QlikView
- :
- Full accumulation not working for Line Chart on QV...
- Subscribe to RSS Feed
- Mark Topic as New
- Mark Topic as Read
- Float this Topic for Current User
- Bookmark
- Subscribe
- Mute
- Printer Friendly Page

 Jesh19
- Mark as New
- Bookmark
- Subscribe
- Mute
- Subscribe to RSS Feed
- Permalink
- Report Inappropriate Content
Full accumulation not working for Line Chart on QV server
Hi All,
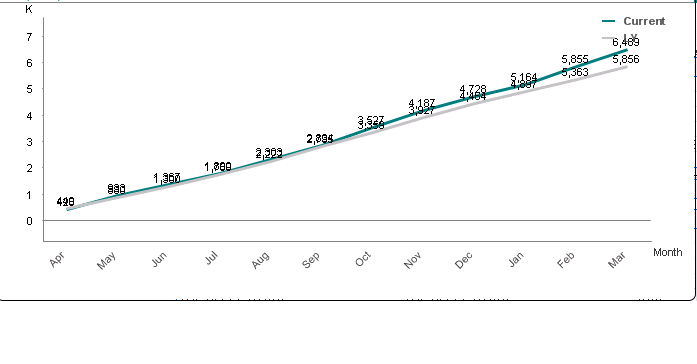
I'm having the below line chart where I'm showing my current and last year expressions as full accumulated values.
It's working fine on Qlikview Desktop. But, when moved onto server it's behaving really very odd.
Qlikview Desktop -
Qlikview Server -
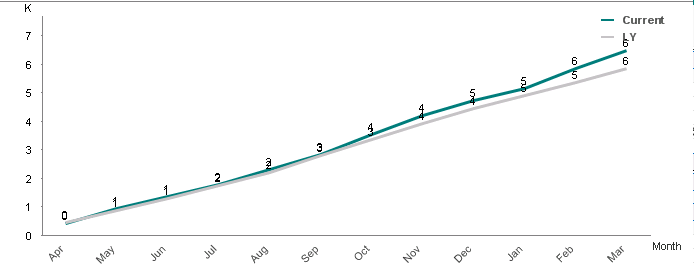
Dimension used is Month and my expression is as follows:
RangeSum(above(TOTAL Sum({<MC_Period=, MC_Year=, MC_Quarter=, MC_Week=,
MC_Period={">=$(=Date(YearStart(max(MC_Period), 0, 4))) <$(=addmonths(MC_Period, 1))"}>} FS_ActualChargeable_Aggr)/1000,0,RowNo(TOTAL))) -- Similar one for last year
Could someone please help me with the above issue.
Thanks in advance.
Regards,
Jesh
- Tags:
- stefan wühl

 marcus_sommer
- Mark as New
- Bookmark
- Subscribe
- Mute
- Subscribe to RSS Feed
- Permalink
- Report Inappropriate Content
Both charts look quite identically unless the different number-formatting on the lines. Normally the settings should be result in the same output - why not I don't know. One reason could be that client and server are on different releases.
If this is the case you could adjust the releases or trying to find settings which result in the same output for both maybe also with a num(AroundYourExpression, 'YourFormat) by using the expression-default in tab numbers for the lines.
- Marcus
