Unlock a world of possibilities! Login now and discover the exclusive benefits awaiting you.

- Qlik Community
- :
- All Forums
- :
- QlikView
- :
- Gantt (Pivot Table) with multiple values for a dim...
- Subscribe to RSS Feed
- Mark Topic as New
- Mark Topic as Read
- Float this Topic for Current User
- Bookmark
- Subscribe
- Mute
- Printer Friendly Page

 belromvar
- Mark as New
- Bookmark
- Subscribe
- Mute
- Subscribe to RSS Feed
- Permalink
- Report Inappropriate Content
Gantt (Pivot Table) with multiple values for a dimension
Hi,
Is there a way to create a gantt diagram with more than one value for each dimension?
My data looks like:
| ID | Type | Subtype | From | To |
|---|---|---|---|---|
| A | A1 | A11 | 01.01.2018 | 13.01.2018 |
| A | A1 | A12 | 05.01.2018 | 10.01.2018 |
| A | A2 | A21 | 15.12.2017 | 15.01.2018 |
| A | A3 | A31 | 03.11.2017 | 18.12.2017 |
| A | B4 | B11 | 24.11.2017 | 25.11.2017 |
| ... | ... | ... | ... | ... |
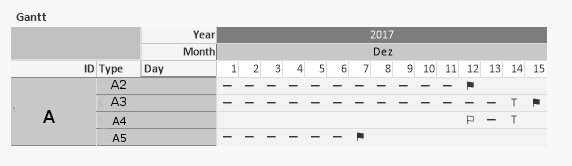
In my chart I want to show the ID, the type and the calendar info. I followed this example: How to create a Gantt chart using a Pivot table, however it only works for one value per dimension (A1 will not be shown, since it is the aggregation of A11 and A12 subtypes).
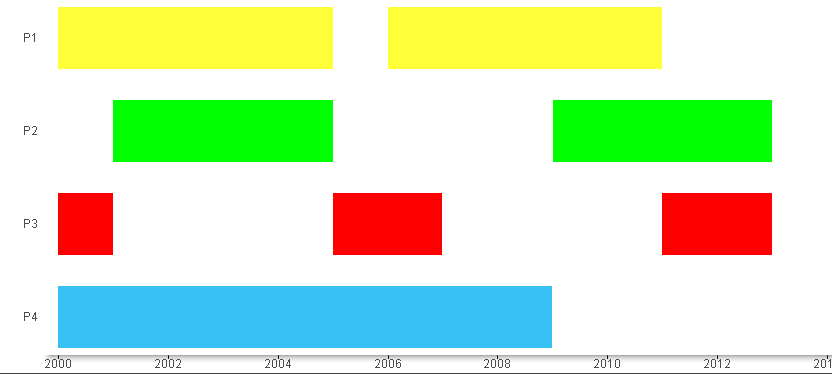
My goal:
What I have:
I appreciate any ideas or suggestions?

 sunny_talwar
- Mark as New
- Bookmark
- Subscribe
- Mute
- Subscribe to RSS Feed
- Permalink
- Report Inappropriate Content
What is the expression that you use?
belromvar
- Mark as New
- Bookmark
- Subscribe
- Mute
- Subscribe to RSS Feed
- Permalink
- Report Inappropriate Content
I forgot to mention I am using a MasterCalendar. The dimensions are ID, Type, Year, Month, Day. The expression is:
=if([Zeitraum Von]=[Zeitraum Bis],'⚡',
if(date(ReferenceDate)=date(Today()),'T',
if([Zeitraum Von] = ReferenceDate,'⚐',
if([Zeitraum Bis] = ReferenceDate,'⚑',
if([Zeitraum Bis]-ReferenceDate+1>0,'⚊')))))
sunny_talwar
- Mark as New
- Bookmark
- Subscribe
- Mute
- Subscribe to RSS Feed
- Permalink
- Report Inappropriate Content
What is reference date here?
belromvar
- Mark as New
- Bookmark
- Subscribe
- Mute
- Subscribe to RSS Feed
- Permalink
- Report Inappropriate Content
ReferenceDate was defined in the MasterCalendar, it´s a date i.e. 2017.12.04
sunny_talwar
- Mark as New
- Bookmark
- Subscribe
- Mute
- Subscribe to RSS Feed
- Permalink
- Report Inappropriate Content
Are you doing an interval match between your data and master calendar?
belromvar
- Mark as New
- Bookmark
- Subscribe
- Mute
- Subscribe to RSS Feed
- Permalink
- Report Inappropriate Content
No, I have an Events_Dates table:
Events_x_Dates:
Load ID, Type, Subtype, Date(From + IterNo()-1) as ReferenceDate
Resident Events
While IterNo() <= To - From + 1 ;
