Unlock a world of possibilities! Login now and discover the exclusive benefits awaiting you.
- Qlik Community
- :
- All Forums
- :
- QlikView
- :
- Gap ON data
- Subscribe to RSS Feed
- Mark Topic as New
- Mark Topic as Read
- Float this Topic for Current User
- Bookmark
- Subscribe
- Mute
- Printer Friendly Page
- Mark as New
- Bookmark
- Subscribe
- Mute
- Subscribe to RSS Feed
- Permalink
- Report Inappropriate Content
Gap ON data
Hi,
My pb is a little bit weird, In fact the sum displyed is correct but whene I do an excel extract the sum is not exactly the same.
Could you help me ti figure out why?
here is the expression that I used :

An other question, what is the difference between 'Total de l'expression' / 'Somme de ligne'?
The excel extract is attached.
Thanks
- Mark as New
- Bookmark
- Subscribe
- Mute
- Subscribe to RSS Feed
- Permalink
- Report Inappropriate Content
Maybe it's easier to understand and help if you could upload the excel file and more details about your QV application (chart expressions / dimensions / settings and data model information), best by uploading your sample QVW.
- Mark as New
- Bookmark
- Subscribe
- Mute
- Subscribe to RSS Feed
- Permalink
- Report Inappropriate Content
Hi Swuel, I cant' upload an excel file here.
Thanks
- Mark as New
- Bookmark
- Subscribe
- Mute
- Subscribe to RSS Feed
- Permalink
- Report Inappropriate Content
You technically can't do it?
You should be able to do this:
Or you don't want to share your excel file and sample for any other reason?
- Mark as New
- Bookmark
- Subscribe
- Mute
- Subscribe to RSS Feed
- Permalink
- Report Inappropriate Content
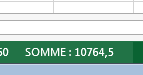
Thanks Swuel, I just saw the attach file now. I thought we can't attach any file to the discussion.
The excel file is attached for your info. as I said before, the displayed sum is correcte, the same in the database but whene we do the sum in excel, there is a gap. see bellow :
- Mark as New
- Bookmark
- Subscribe
- Mute
- Subscribe to RSS Feed
- Permalink
- Report Inappropriate Content
Ok, but still it's necessary to know at least what expression you are using in the table chart?
Also if you have changed the total mode from expression total to another mode.
- Mark as New
- Bookmark
- Subscribe
- Mute
- Subscribe to RSS Feed
- Permalink
- Report Inappropriate Content
As requested,please see bellow :
PS: the table used is a pivot table
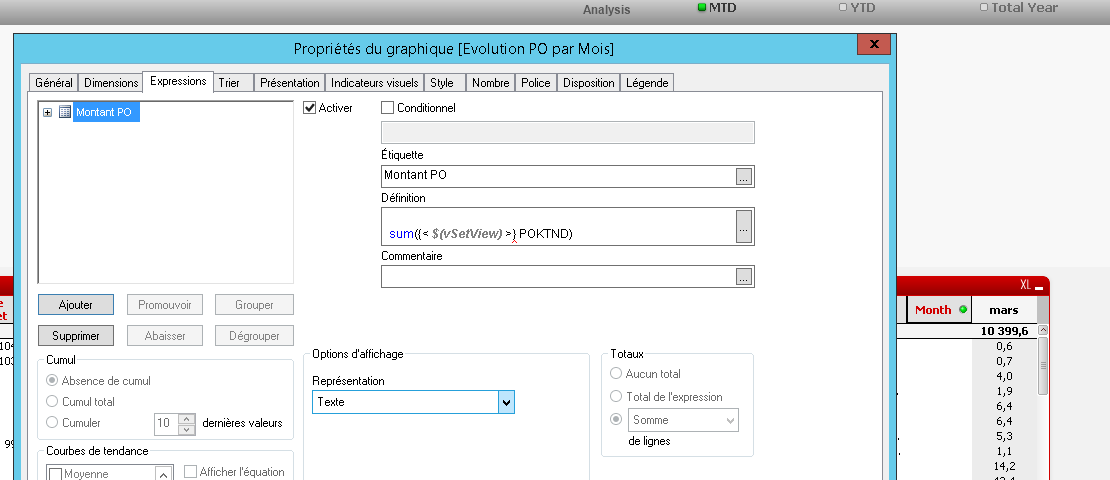
why when we use a pivot table the totaux tab become disabled?
What is the difference between 'Total de l'expression' / 'Somme de ligne'?
Thanks
- Mark as New
- Bookmark
- Subscribe
- Mute
- Subscribe to RSS Feed
- Permalink
- Report Inappropriate Content
The sum-of-rows total mode is summing up the expressions result for each dimensional line, while 'expression total' total mode evaluates the expression in the context without dimensions, then use this result as total.
For example, if you are using a condition that checks on your dimension value:
=if(Dimension ='A', -Sum(Value), Sum(Value) )
then this will probably return different results in both modes.
Pivot table only allow 'expression total' as total mode, but there is a workaround using advanced aggregation:
=Sum( Aggr( YourExpression, AllyourChartDimensionFieldsCommaSeparated))
I still can't see your complete expression, you are using an variable and don't tell how this variable is defined 
- Mark as New
- Bookmark
- Subscribe
- Mute
- Subscribe to RSS Feed
- Permalink
- Report Inappropriate Content
Hi , Here is my expression :
sum( {< $(vSetView)>} POKTND)
with : $(vSetView)
=pick(ViewId,
'$(vSetMTD)',
'$(vSetYTD)',
'$(vSetTotal)')
so that the values of my measures change with the selection : MTD/YTD/Total year
Whene I use Sum ( Aggr( Sum({< $(vSetView)>} POKTND) , LB,Famille,CODE_PROJET,PO_FOURNISSEUR,PO_NUM_COMMANDE,PO_COMMENTS, PO_ACHETEUR,[Month of date], CDR) )
The result is : it does taking into account the selection YTD and the total of June is not correct :
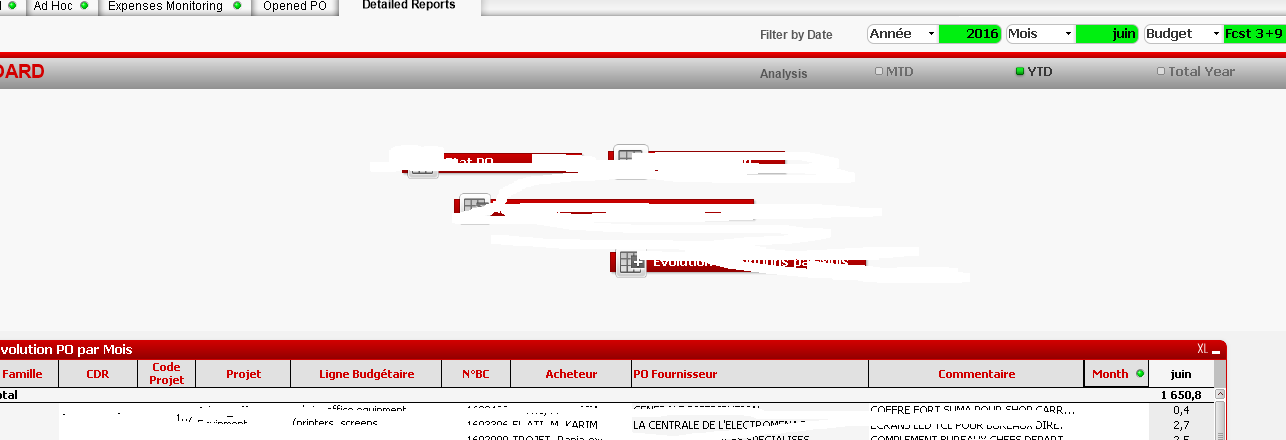
I would like the result to be a pivot table with total measures= extract excel

Any help please.
Thanks