Unlock a world of possibilities! Login now and discover the exclusive benefits awaiting you.
- Qlik Community
- :
- All Forums
- :
- QlikView
- :
- Gauge chart creation
- Subscribe to RSS Feed
- Mark Topic as New
- Mark Topic as Read
- Float this Topic for Current User
- Bookmark
- Subscribe
- Mute
- Printer Friendly Page
- Mark as New
- Bookmark
- Subscribe
- Mute
- Subscribe to RSS Feed
- Permalink
- Report Inappropriate Content
Gauge chart creation
Hi
Can some one help me in creating the gauge chart
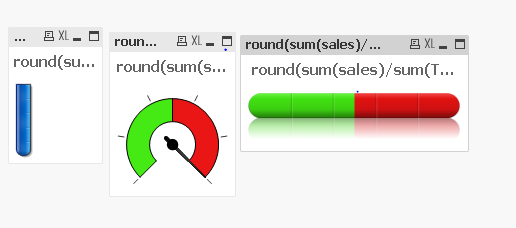
any of the below charts would be helpful
- Tags:
- chart types
- charts explained
- choosing charts
- gauge chart
- gauge setting
- new to qlikivew
- new to qlikview
- new_to_qlikview
- set analaysis
Accepted Solutions
- Mark as New
- Bookmark
- Subscribe
- Mute
- Subscribe to RSS Feed
- Permalink
- Report Inappropriate Content
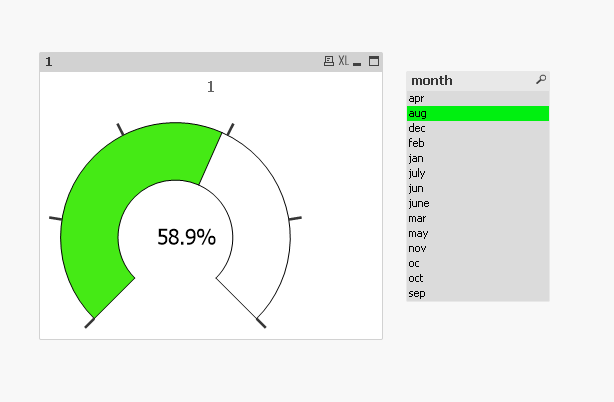
Expression tab: One expression=1
Presentation tab Segment 1 =0
Segment 2 = =sum(sales)/sum({1} sales)
Text in Chart: =num(sum(sales)/sum({1} sales),'00.0%')
- Mark as New
- Bookmark
- Subscribe
- Mute
- Subscribe to RSS Feed
- Permalink
- Report Inappropriate Content
Expression tab: One expression=1
Presentation tab Segment 1 =0
Segment 2 = =sum(sales)/sum({1} sales)
Text in Chart: =num(sum(sales)/sum({1} sales),'00.0%')
- Mark as New
- Bookmark
- Subscribe
- Mute
- Subscribe to RSS Feed
- Permalink
- Report Inappropriate Content
Hi Robert
When i was trying to convert the same gauge chart to test tube chart
I'm unable to see the change in colour in test tube chart can you pleas ehelp me out
- Mark as New
- Bookmark
- Subscribe
- Mute
- Subscribe to RSS Feed
- Permalink
- Report Inappropriate Content
Here are examples you can fallow.