Unlock a world of possibilities! Login now and discover the exclusive benefits awaiting you.

- Qlik Community
- :
- All Forums
- :
- QlikView
- :
- Gauges
- Subscribe to RSS Feed
- Mark Topic as New
- Mark Topic as Read
- Float this Topic for Current User
- Bookmark
- Subscribe
- Mute
- Printer Friendly Page

- Mark as New
- Bookmark
- Subscribe
- Mute
- Subscribe to RSS Feed
- Permalink
- Report Inappropriate Content
Gauges
how to display values on gauges? Is it possible to have a range of values 0-100 displayed on the gauge itself and also to highlight the value got after evaluating the expression.
I used the following values in the presentation tabs
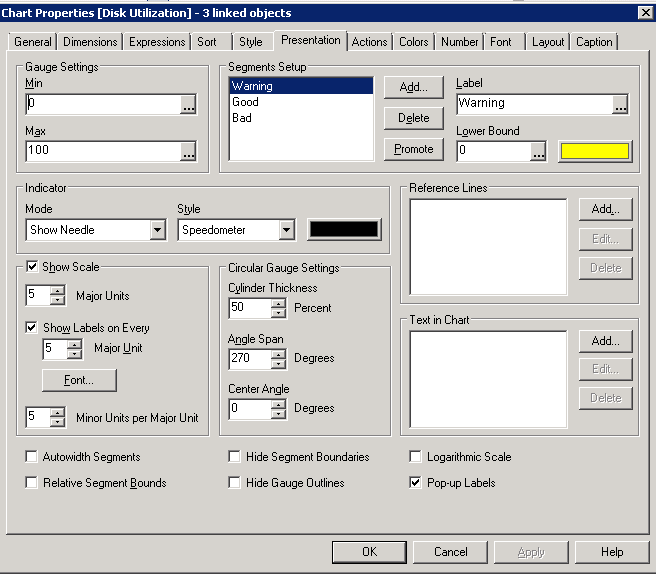
And the gauge I get is,

Is there a way to make the gauge in the center and add the values on the scale and higlight the value the needle is pointing to?
Accepted Solutions

 amars
amars
- Mark as New
- Bookmark
- Subscribe
- Mute
- Subscribe to RSS Feed
- Permalink
- Report Inappropriate Content
You can press Ctrl + Shift a red border will appear and you can move your Guage in the middle.
Also for the value to be shown inside the chart, u can use the Text in Chart feature, Just copy your expression and paste it using the add button inside the Text in Chart border.
Thanks...
amars
- Mark as New
- Bookmark
- Subscribe
- Mute
- Subscribe to RSS Feed
- Permalink
- Report Inappropriate Content
You can press Ctrl + Shift a red border will appear and you can move your Guage in the middle.
Also for the value to be shown inside the chart, u can use the Text in Chart feature, Just copy your expression and paste it using the add button inside the Text in Chart border.
Thanks...
- Mark as New
- Bookmark
- Subscribe
- Mute
- Subscribe to RSS Feed
- Permalink
- Report Inappropriate Content
I wish we didn't have to do the scales in the gauges using the text... its too tedious... I hope qlik comes up with a solution soon