Unlock a world of possibilities! Login now and discover the exclusive benefits awaiting you.
- Qlik Community
- :
- All Forums
- :
- QlikView
- :
- Google Maps - Cluster
- Subscribe to RSS Feed
- Mark Topic as New
- Mark Topic as Read
- Float this Topic for Current User
- Bookmark
- Subscribe
- Mute
- Printer Friendly Page
- Mark as New
- Bookmark
- Subscribe
- Mute
- Subscribe to RSS Feed
- Permalink
- Report Inappropriate Content
Google Maps - Cluster
Google Maps Extension with Cluster support.
QlikTech takes no responsibility for any code and QlikTech Support Agreement does not cover issues with this extension.
Please review Googles license agreement before you put this into production.
Introduction
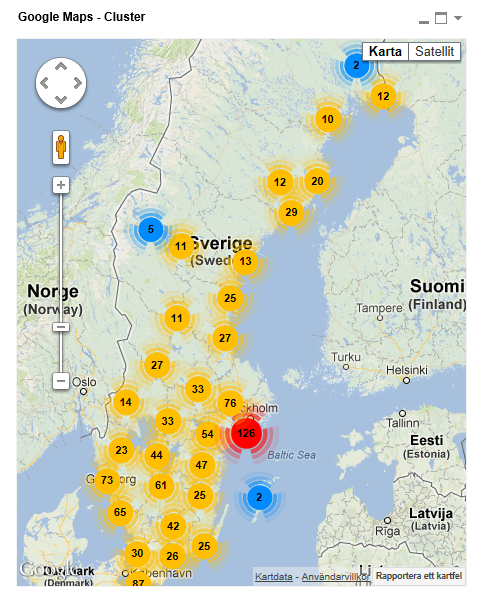
This is a QlikView extension object that integrates Google Maps Javascript API V3 and a third party library called MarkerClusterPlus into QlikView.
Load a set a coordinates into QlikView and visualize them together with this extension. The clustering feature is create when you have alot of data points and needs to group/cluster them together for greater visability and performance.
The maxzoom property defines at what zoom level you want your markers clustered. The grid size property controls how big or small cluster grid size you want.
You can either use the extension 'as is' or use it as a base to further customize it to fit your needs.
Download the extension and view source code at: https://github.com/mindspank/GoogleMaps-Cluster-QV11
If you build something awesome please share it with the community!
Live long and prosper.
2015-02-15
Removed download from post, please grab the latest version from Github instead.
2014-02-03
Various fixes.
2014-01-09
There has been numerous upgrades to the extension.
Now clusters now display the value of your expression and with added support to include more information in pop-up labels.
Example grayscale styled map included.
Possibility to show only a single cluster icon style if you do not want it to scale according to the number of markers in the cluster.
2013-06-17
Added custom marker support. Now you can specify a url for an custom marker. Accepts all major image file types.
- Tags:
- clustering
- extension
- extension_object
- geospatial
- google cluster maps
- google maps
- javascript
- map
- mapping
- qlikview extensions
- qlikview_extensions
- Mark as New
- Bookmark
- Subscribe
- Mute
- Subscribe to RSS Feed
- Permalink
- Report Inappropriate Content
Just downloaded and reinstalled the extension, same problem. Lat and Long in the list as 0.0000 and the maps just shows nothing but grey. Either selecting excluded or using a case statement in the sql to convert to nulls works but by default the map is just grey if those records exist.
- Mark as New
- Bookmark
- Subscribe
- Mute
- Subscribe to RSS Feed
- Permalink
- Report Inappropriate Content
One other thing is that as the records increase the app crashes. Is there a way to have a an option for maximum records shown and have it default to something low enough for the app to not crash? At the moment I have to select a single row then click over to web view then modify the settings otherwise the app bombs.
- Mark as New
- Bookmark
- Subscribe
- Mute
- Subscribe to RSS Feed
- Permalink
- Report Inappropriate Content
Hmm strange, any chance you can share the data set with me? Just the coordinates would be enough, akl@qlik.com
Yeah in the definition.xml file you can set the PageHeight property which controls how much data is exposed to the extension.
Actually as I was looking at the code today I can probably tweak it even further to speed up the process, let me have a look at it tomorrow.
- Mark as New
- Bookmark
- Subscribe
- Mute
- Subscribe to RSS Feed
- Permalink
- Report Inappropriate Content
Looks like the app is crashing due to invalid Lat and Long. I have some records that come out as 0.0000. As long as my filters don't include those records then the app works. The second it has to try and process those it crashes. FYI in case you can force it to ignore invalid lat and long coords.
Thanks!
- Mark as New
- Bookmark
- Subscribe
- Mute
- Subscribe to RSS Feed
- Permalink
- Report Inappropriate Content
Hi I wondered if you could help me. I've added the extension and it is all working perfectly except that I do not know how to get the clusters to show how many are within their group. No matter what I try I am always getting zeros. I know it will be something obvious, I'm pretty new to this, hope you can help. I want the clusters to show a count of the user ids within them. Could you tell me how to achieve that please? 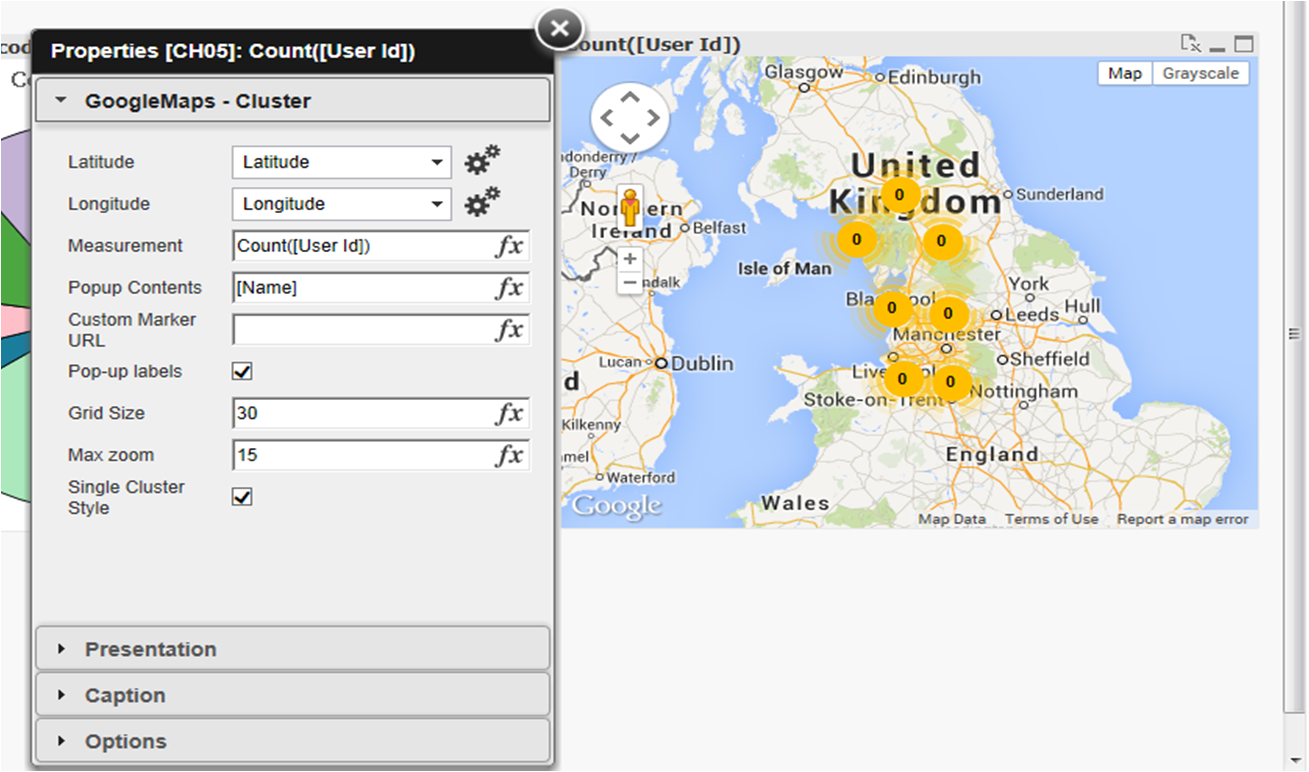
- Mark as New
- Bookmark
- Subscribe
- Mute
- Subscribe to RSS Feed
- Permalink
- Report Inappropriate Content
Hi, im trying to use this extension but i get this error:
Can you help me??
Thanks,

- Mark as New
- Bookmark
- Subscribe
- Mute
- Subscribe to RSS Feed
- Permalink
- Report Inappropriate Content
Hi Charlotte
I had similar issues and it was the LAN settings on the server
In internet explorer go to Internet Options/LAN Settings
apply the appropriate settings in Proxy Server for your network (see the IT Admin folk for this)
and do the same in the Advanced section
Regards
John
- Mark as New
- Bookmark
- Subscribe
- Mute
- Subscribe to RSS Feed
- Permalink
- Report Inappropriate Content
Hi Alex,
I want to ask something, i have an issue where the cluster circle color doesn't change at all, it's all yellow, i can't see any different color even when the digit reach 100++. Also i want to ask can this cluster extension separate the product i choose into 2 or more cluster, example :
i have 2 product A and B:
i want the product A cluster circle is yellow while product B cluster circle is red, can i do something like this?
sorry for my bad English and also Thank You before.
- Mark as New
- Bookmark
- Subscribe
- Mute
- Subscribe to RSS Feed
- Permalink
- Report Inappropriate Content
Hi Alexander,
I m getting the stack overflow error while dragging the map object.
Can you suggest me what might be issue?
- Mark as New
- Bookmark
- Subscribe
- Mute
- Subscribe to RSS Feed
- Permalink
- Report Inappropriate Content
Hi Sneha,
I was getting the same error on script, and checking the lat and lng data, all seems OK, but after couples of weeks trying to figure out, I realized that the problem is on the script command added automatically on the Main page:
SET ThousandSep='.';
SET DecimalSep=',';
the above commands are default for Brazilian number, but mismatch the lat and lng data, instead try to change to:
SET ThousandSep=',';
SET DecimalSep='.';
just invert the comma x dot.
It worked and solved my problem.
rgds
Edson