Unlock a world of possibilities! Login now and discover the exclusive benefits awaiting you.

- Qlik Community
- :
- All Forums
- :
- QlikView
- :
- Graphic indicator: needle does not move
- Subscribe to RSS Feed
- Mark Topic as New
- Mark Topic as Read
- Float this Topic for Current User
- Bookmark
- Subscribe
- Mute
- Printer Friendly Page

- Mark as New
- Bookmark
- Subscribe
- Mute
- Subscribe to RSS Feed
- Permalink
- Report Inappropriate Content
Graphic indicator: needle does not move
Hello:
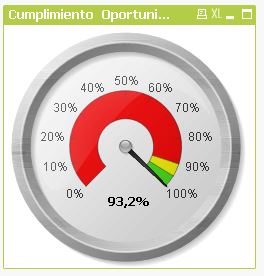
I am using a graphic indicator but the needle does not show the correct value. In the graphic below, the needle is on the 100% point and it has to be on 93,2%. The expression I am using is: avg([% Oportunidad]). In the presentation section, text in graph, the expression I am using is: =num(Avg([% Oportunidad]),'##,0%').
Is there something else I must to consider?. I´ve been using other graphics indicator in others sheets and they are working ok.
thanks a lot for your help
- Tags:
- new_to_qlikview
- Mark as New
- Bookmark
- Subscribe
- Mute
- Subscribe to RSS Feed
- Permalink
- Report Inappropriate Content
Its little annoying why this chart is not working. To debug please use little data (or make selections) & check manually expression working correctly or not.
Please provide the small data qvw.