Unlock a world of possibilities! Login now and discover the exclusive benefits awaiting you.

- Qlik Community
- :
- All Forums
- :
- QlikView
- :
- Grouped Dimension in Line chart
- Subscribe to RSS Feed
- Mark Topic as New
- Mark Topic as Read
- Float this Topic for Current User
- Bookmark
- Subscribe
- Mute
- Printer Friendly Page

- Mark as New
- Bookmark
- Subscribe
- Mute
- Subscribe to RSS Feed
- Permalink
- Report Inappropriate Content
Grouped Dimension in Line chart
Hi All,
Is it Possible to create a grouped dimension of month and year as shown below in line chart??
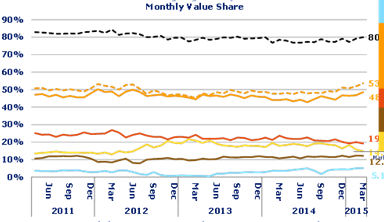
Please help.
Regards,
Reena
- Tags:
- new dimension

 MK_QSL
- Mark as New
- Bookmark
- Subscribe
- Mute
- Subscribe to RSS Feed
- Permalink
- Report Inappropriate Content
Yes... Create MonthYear in your script and use it in your line table dimension
Date(MonthStart(YourDateField),'MMM-YYYY') as MonthYear
- Mark as New
- Bookmark
- Subscribe
- Mute
- Subscribe to RSS Feed
- Permalink
- Report Inappropriate Content
Thanks Manish..for the reply.
Other than that is it possible to create a UI similar to the chart attched.. ?

 sujeetsingh
- Mark as New
- Bookmark
- Subscribe
- Mute
- Subscribe to RSS Feed
- Permalink
- Report Inappropriate Content
Reena,
Derive Year,Month and then try playing at UI you may get a similar representation .
MK_QSL
- Mark as New
- Bookmark
- Subscribe
- Mute
- Subscribe to RSS Feed
- Permalink
- Report Inappropriate Content
Create Calculated Dimesion
=Date#(Month& '-' & Year,'MMM-YYYY')
Remove Year and Month from your diemnsion.
 Kushal_Chawda
- Mark as New
- Bookmark
- Subscribe
- Mute
- Subscribe to RSS Feed
- Permalink
- Report Inappropriate Content
add two calculated dimensions
Year(Date)
month(Date)

 tresB
tresB
- Mark as New
- Bookmark
- Subscribe
- Mute
- Subscribe to RSS Feed
- Permalink
- Report Inappropriate Content
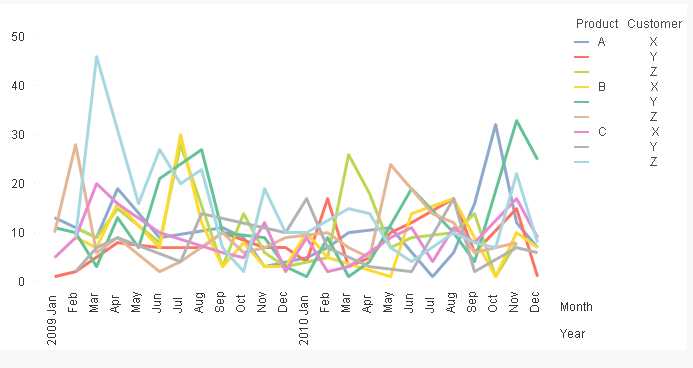
Please find the attached sample. Credit to JohnW (one of the better contributors)
- Mark as New
- Bookmark
- Subscribe
- Mute
- Subscribe to RSS Feed
- Permalink
- Report Inappropriate Content
i hope the below Qvw file is helpful to you !

 brandk
- Mark as New
- Bookmark
- Subscribe
- Mute
- Subscribe to RSS Feed
- Permalink
- Report Inappropriate Content
Hi, is there a way I can convert this to Qliksense compatible file