Unlock a world of possibilities! Login now and discover the exclusive benefits awaiting you.

- Qlik Community
- :
- All Forums
- :
- QlikView
- :
- Grouping in a chart
- Subscribe to RSS Feed
- Mark Topic as New
- Mark Topic as Read
- Float this Topic for Current User
- Bookmark
- Subscribe
- Mute
- Printer Friendly Page

 sergi_arbos
- Mark as New
- Bookmark
- Subscribe
- Mute
- Subscribe to RSS Feed
- Permalink
- Report Inappropriate Content
Grouping in a chart
I have a table with expedients and their OpenDate and CloseDate.
If an expedient is open for 1 to 5 days it must belong to group 1, if is open for 6 to 15, group 2, if it is open for 16 to 30 days then it must be on group 3... and so up to 8 groups.
My costumer wants to be able to choose an interval date StartDate and EndDate and then wants to know:
How many expedients are open (StartDate < CloseDate) in each group in that interval AND the sum of the days of the expedients in each group in the interval.
Result expected:
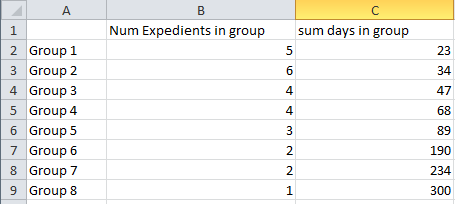
Caveas:
The group depends on the EndDate selected dynamically by the user, I mean:
if an expedient is open for 50 days (group 4) but the user selects the EndDate as OpenDate + 8, the expedient must be added to the Group 2 (from 6 to 15 days) and only 8 days must be add to the sum of the days on that group (not 50 days).
Thanks in advance,

 sunny_talwar
- Mark as New
- Bookmark
- Subscribe
- Mute
- Subscribe to RSS Feed
- Permalink
- Report Inappropriate Content
I think you can use variables to take user inputs and set the ranges by using those variables. You have not provided a raw data sample to show you how it can be done, but I guess if you try it, you might be able to accomplish it on your own 
sergi_arbos
- Mark as New
- Bookmark
- Subscribe
- Mute
- Subscribe to RSS Feed
- Permalink
- Report Inappropriate Content
I've been two full days working in it and I couldn't find any solution... nor my fellow coworkers.
I can give you some data, but it's only: expedient code, opendate, closedate
The problem is showing the data in a dimension (group1, group2...) that is dinamic as the user selects the StartData and EndData.
sunny_talwar
- Mark as New
- Bookmark
- Subscribe
- Mute
- Subscribe to RSS Feed
- Permalink
- Report Inappropriate Content
Yes those are the fields that we would need to come up with the solution. Please provide that information in an Excel file.
sergi_arbos
- Mark as New
- Bookmark
- Subscribe
- Mute
- Subscribe to RSS Feed
- Permalink
- Report Inappropriate Content
I've solved it with a custom dimension with an "if" for each group.
