Unlock a world of possibilities! Login now and discover the exclusive benefits awaiting you.
- Qlik Community
- :
- All Forums
- :
- QlikView
- :
- Re: Heat map in Qlikview
- Subscribe to RSS Feed
- Mark Topic as New
- Mark Topic as Read
- Float this Topic for Current User
- Bookmark
- Subscribe
- Mute
- Printer Friendly Page
- Mark as New
- Bookmark
- Subscribe
- Mute
- Subscribe to RSS Feed
- Permalink
- Report Inappropriate Content
Heat map in Qlikview
Dear All,
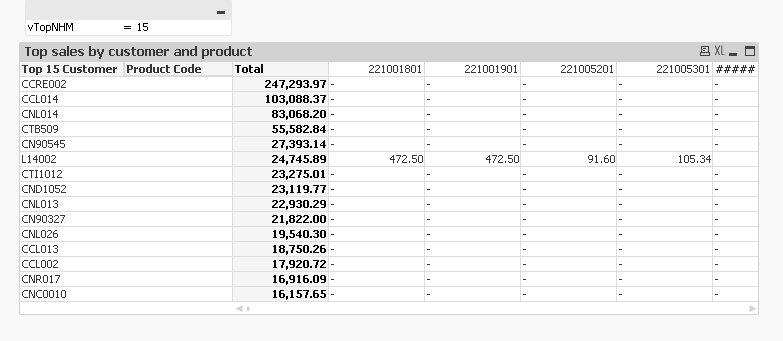
I am trying to create heat map using pivot table with below mentioned calculated dimensions and metric.
Customer =aggr(if(rank(aggr(sum(SalesValue*SalesQty), CustomerCode) <= $(vTopNHM)), CustomerName),CustomerName)
products =aggr(if(rank(aggr(sum(SalesValue*SalesQty), ProductCode) <= $(vTopNHM)), ProductCode),ProductCode)
expression sum(SalesValue*SalesQty)
I am using a variable in the input box to provide the number of customer information the user want to see. But however after entering the number in input box, the chart is not updating. It is showing all customer information.
Any suggestions where i am going wrong ?
Thank you.
Regards,
VK
- Mark as New
- Bookmark
- Subscribe
- Mute
- Subscribe to RSS Feed
- Permalink
- Report Inappropriate Content
Top 15 customer? but you have a calculated dimension for top products also, right?
- Mark as New
- Bookmark
- Subscribe
- Mute
- Subscribe to RSS Feed
- Permalink
- Report Inappropriate Content
Pivot table sorting will always be challenging... will try to address after we fix the other part
- Mark as New
- Bookmark
- Subscribe
- Mute
- Subscribe to RSS Feed
- Permalink
- Report Inappropriate Content
thank you. Please let me know once you have updates.
- Mark as New
- Bookmark
- Subscribe
- Mute
- Subscribe to RSS Feed
- Permalink
- Report Inappropriate Content
yes i have calculated dimension for both but i need the customer based on sales value. Need not to sort on product dimension.
- Mark as New
- Bookmark
- Subscribe
- Mute
- Subscribe to RSS Feed
- Permalink
- Report Inappropriate Content
Not talking about the sort by product... all I am asking is why is product a calculated dimension when you don't want top 5 or 15 products?
- Mark as New
- Bookmark
- Subscribe
- Mute
- Subscribe to RSS Feed
- Permalink
- Report Inappropriate Content
The reason is when i looking at the top sales, i also want to know that which products are contributing that sales.
I need both top customer by sales value in descending order and products which are contributing those sales.
Please let me know if i am not clear.
thanks
- Mark as New
- Bookmark
- Subscribe
- Mute
- Subscribe to RSS Feed
- Permalink
- Report Inappropriate Content
But you want to see all products that are contributing it, right? not just the top 10 or top 15?
- Mark as New
- Bookmark
- Subscribe
- Mute
- Subscribe to RSS Feed
- Permalink
- Report Inappropriate Content
Yes sunny. If i enter 10 in the input box, it should give me the top 10 customers by sales and products which are contributing that sale.
- Mark as New
- Bookmark
- Subscribe
- Mute
- Subscribe to RSS Feed
- Permalink
- Report Inappropriate Content
Here you go
- Mark as New
- Bookmark
- Subscribe
- Mute
- Subscribe to RSS Feed
- Permalink
- Report Inappropriate Content
I will check and will update you.
Thank you so much.