Unlock a world of possibilities! Login now and discover the exclusive benefits awaiting you.
Announcements
Now accepting applications for the Qlik Luminary and Partner Ambassador Programs: Apply by July 6!
- Qlik Community
- :
- All Forums
- :
- QlikView
- :
- Help to display Bar chart Labels
Options
- Subscribe to RSS Feed
- Mark Topic as New
- Mark Topic as Read
- Float this Topic for Current User
- Bookmark
- Subscribe
- Mute
- Printer Friendly Page
Turn on suggestions
Auto-suggest helps you quickly narrow down your search results by suggesting possible matches as you type.
Showing results for
Not applicable
2015-05-19
11:25 PM
- Mark as New
- Bookmark
- Subscribe
- Mute
- Subscribe to RSS Feed
- Permalink
- Report Inappropriate Content
Help to display Bar chart Labels
Hi,
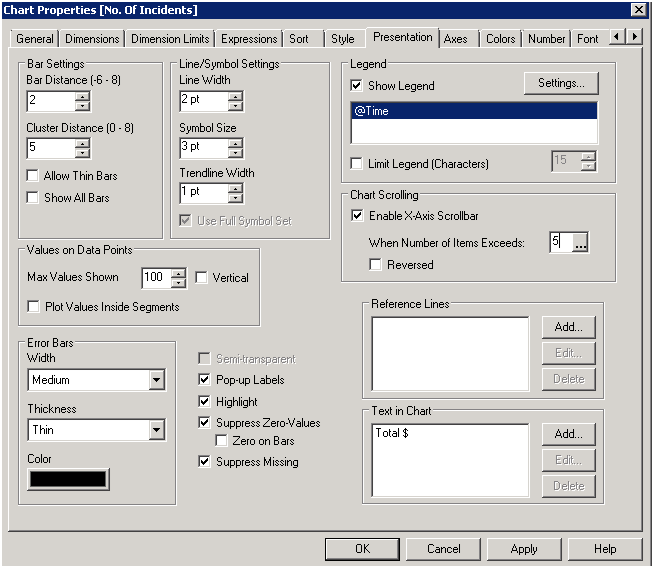
I am trying to display "Revuenue by city" Bar chart since there are too many values data pionts are overlapping on each other , help me to display in best way.Please see attachment for reference.
- Tags:
- new_to_qlikview
544 Views
1 Solution
Accepted Solutions
Master III
2015-05-20
12:20 AM
- Mark as New
- Bookmark
- Subscribe
- Mute
- Subscribe to RSS Feed
- Permalink
- Report Inappropriate Content
Hi,
You can enable X-Axis Scrolbar s , limit your bars to 5 or 10
Thanks,
AS
485 Views
1 Reply
Master III
2015-05-20
12:20 AM
- Mark as New
- Bookmark
- Subscribe
- Mute
- Subscribe to RSS Feed
- Permalink
- Report Inappropriate Content
Hi,
You can enable X-Axis Scrolbar s , limit your bars to 5 or 10
Thanks,
AS
486 Views