Unlock a world of possibilities! Login now and discover the exclusive benefits awaiting you.

- Qlik Community
- :
- All Forums
- :
- QlikView
- :
- Help to do a StakedBar chart
- Subscribe to RSS Feed
- Mark Topic as New
- Mark Topic as Read
- Float this Topic for Current User
- Bookmark
- Subscribe
- Mute
- Printer Friendly Page

- Mark as New
- Bookmark
- Subscribe
- Mute
- Subscribe to RSS Feed
- Permalink
- Report Inappropriate Content
Help to do a StakedBar chart
Hi Community
I have a problem with a Stacked bar chart
Tab "Graphic2"
Using a table Grafico2 (a table with 3 field) make the Stacked bar chart is very easy
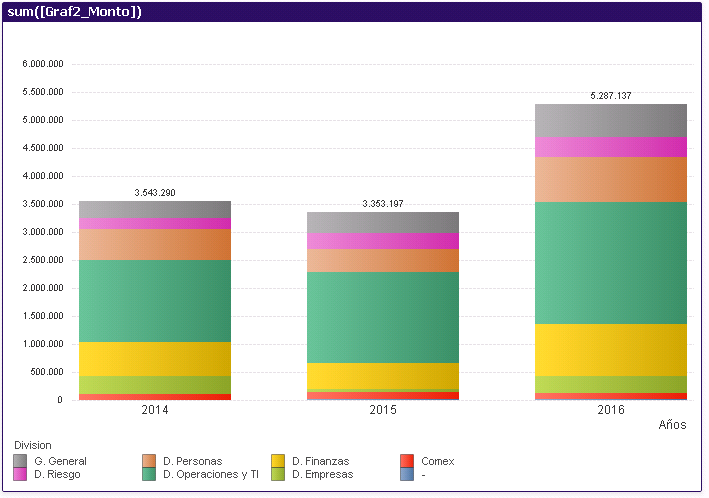
(Image A)
But , and here is my problem
Tab "Graphic1"
Using a table Grafico1 (a table with 4 field) make the Stacked bar is very hard for me
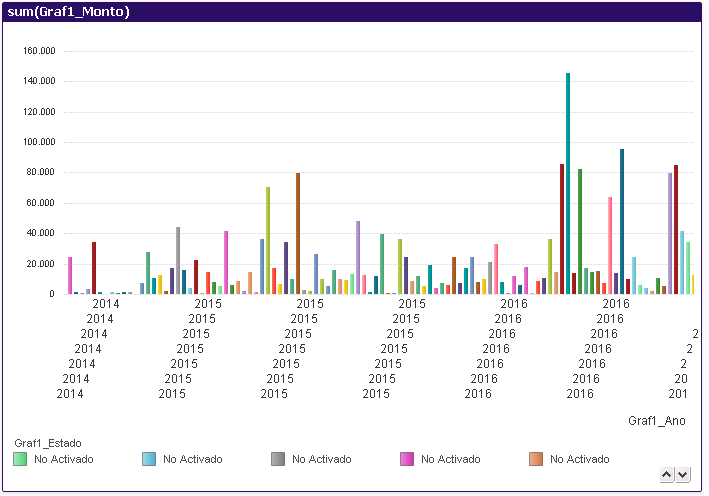
(Image B)
I need to get a Staked Bar chart like the Image A
I add my qvw file
I will apreciate any suggestions
Thanks
Accepted Solutions

 ramoncova06
- Mark as New
- Bookmark
- Subscribe
- Mute
- Subscribe to RSS Feed
- Permalink
- Report Inappropriate Content
tienes un problema con el formato de tus datos
usa =text(Graf1_Ano) y =text(Graf1_Estado) como dimensiones y con eso ya te sale la grafica que quieres
ramoncova06
- Mark as New
- Bookmark
- Subscribe
- Mute
- Subscribe to RSS Feed
- Permalink
- Report Inappropriate Content
tienes un problema con el formato de tus datos
usa =text(Graf1_Ano) y =text(Graf1_Estado) como dimensiones y con eso ya te sale la grafica que quieres
- Mark as New
- Bookmark
- Subscribe
- Mute
- Subscribe to RSS Feed
- Permalink
- Report Inappropriate Content
Hi Ramon
I tried your suggestion, and It works perfectly.
A lot of thanks