Unlock a world of possibilities! Login now and discover the exclusive benefits awaiting you.

- Qlik Community
- :
- All Forums
- :
- QlikView
- :
- Help with special Stacked chart
- Subscribe to RSS Feed
- Mark Topic as New
- Mark Topic as Read
- Float this Topic for Current User
- Bookmark
- Subscribe
- Mute
- Printer Friendly Page

- Mark as New
- Bookmark
- Subscribe
- Mute
- Subscribe to RSS Feed
- Permalink
- Report Inappropriate Content
Help with special Stacked chart
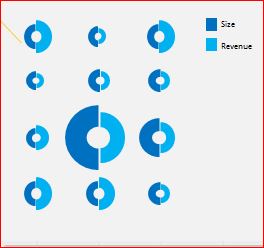
Can any one advice if I can do something similar in QV?
The dimension are Strings of Value segment and tariff plans and the expression are averages on population size and revenue.
Thanks,
Boris
- « Previous Replies
-
- 1
- 2
- Next Replies »
Accepted Solutions

 pgrenier
- Mark as New
- Bookmark
- Subscribe
- Mute
- Subscribe to RSS Feed
- Permalink
- Report Inappropriate Content
Good day Boris,
To the best of my knowlegde, this would be the closest graphical representation to what you are trying to achieve. I have implemented a color density scheme to represent the high/low variation for both Revenue and Population Sizes, with three different Tarif plans (X, Y and Z) over four Value Segments (A, B, C and D):
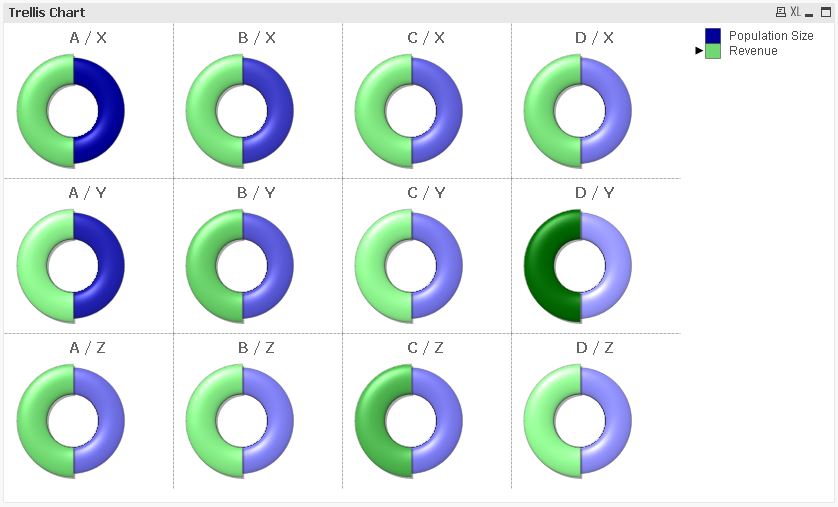
Please find attached the QlikView file where you can see this example.
Regards,
Philippe
- Mark as New
- Bookmark
- Subscribe
- Mute
- Subscribe to RSS Feed
- Permalink
- Report Inappropriate Content
Hi Boris
I think Scatter Chart would do some help in achieving your requirement.
Regards
Nitin
- Mark as New
- Bookmark
- Subscribe
- Mute
- Subscribe to RSS Feed
- Permalink
- Report Inappropriate Content
Hi Boris
I think a bubble chart looks good too
Chris
- Mark as New
- Bookmark
- Subscribe
- Mute
- Subscribe to RSS Feed
- Permalink
- Report Inappropriate Content
tried this one:
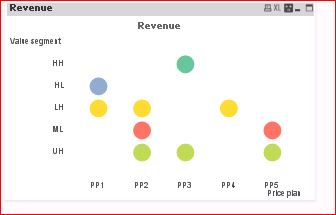
Not what I wanted, its not stacked (and can't be)
- Mark as New
- Bookmark
- Subscribe
- Mute
- Subscribe to RSS Feed
- Permalink
- Report Inappropriate Content
Boris
a bar chart can be stacked
Chris
- Mark as New
- Bookmark
- Subscribe
- Mute
- Subscribe to RSS Feed
- Permalink
- Report Inappropriate Content
Try Scatter Chart,
Bubble chart will not show data as per your req

 Clever_Anjos
- Mark as New
- Bookmark
- Subscribe
- Mute
- Subscribe to RSS Feed
- Permalink
- Report Inappropriate Content
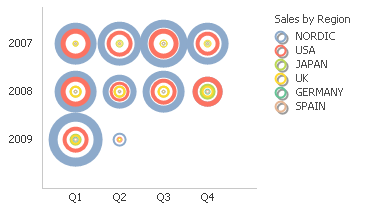
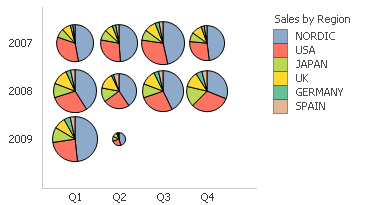
Maybe a Grid Chart?
- Mark as New
- Bookmark
- Subscribe
- Mute
- Subscribe to RSS Feed
- Permalink
- Report Inappropriate Content
Can you please send me an example?
thanks,
Boris
Clever_Anjos
- Mark as New
- Bookmark
- Subscribe
- Mute
- Subscribe to RSS Feed
- Permalink
- Report Inappropriate Content
Check for "Data Visualization.qvw" into your C:\Program Files\QlikView\Examples\Documents its in "Relationship" tab.
Look for this and change the Style
- Mark as New
- Bookmark
- Subscribe
- Mute
- Subscribe to RSS Feed
- Permalink
- Report Inappropriate Content
This has 3 dimensions and 1 expression.
I need 2 dimensions and 2 expressions per dimension that will be stacked in the bubble.
- « Previous Replies
-
- 1
- 2
- Next Replies »