Unlock a world of possibilities! Login now and discover the exclusive benefits awaiting you.
- Qlik Community
- :
- All Forums
- :
- QlikView
- :
- Highlight largest & smallest values in bar chart
- Subscribe to RSS Feed
- Mark Topic as New
- Mark Topic as Read
- Float this Topic for Current User
- Bookmark
- Subscribe
- Mute
- Printer Friendly Page
- Mark as New
- Bookmark
- Subscribe
- Mute
- Subscribe to RSS Feed
- Permalink
- Report Inappropriate Content
Highlight largest & smallest values in bar chart
Hello All -
I'm stuck...
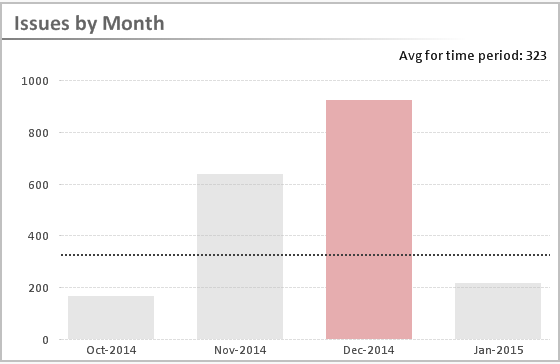
I have a bar chart where I would like to highlight the largest and smallest values in red and green. I'm using the following in the Background Color:
IF(Rank([Issues by Month]) = 1, $(vRed),
IF(Rank (-[Issues by Month]) = 1, $(vDarkGreen),
ARGB(100,192,192,192)))
[Issues by Month] is the expression name for count(DISTINCT Issues.Key)
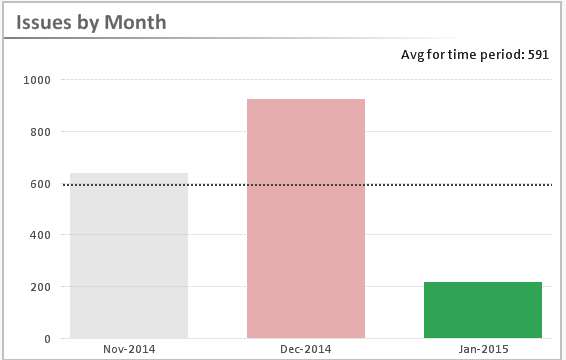
The problem is that I have dates and other data in the app that are before any recorded issues. The smallest value for the expression is Null and out of range of the chart, so it never gets highlighted; if I filter down to months where there are values, it works fine.
I've been trying everything that I can think of, and I'm stumped. How do I limit the background color to a beginning date?
Thanks in advance,
mike
- « Previous Replies
-
- 1
- 2
- Next Replies »
- Mark as New
- Bookmark
- Subscribe
- Mute
- Subscribe to RSS Feed
- Permalink
- Report Inappropriate Content
Top right, the one labeled Issues by Month
- Mark as New
- Bookmark
- Subscribe
- Mute
- Subscribe to RSS Feed
- Permalink
- Report Inappropriate Content
Mike,
Please find the attachment...
min value is not working because you do not have data for aug and sep please provide some data for these then it'll work.
max is working...
- Mark as New
- Bookmark
- Subscribe
- Mute
- Subscribe to RSS Feed
- Permalink
- Report Inappropriate Content
Yup, that was my original problem. Unfortunately, there isn't any data for the first two months.
- Mark as New
- Bookmark
- Subscribe
- Mute
- Subscribe to RSS Feed
- Permalink
- Report Inappropriate Content
yes,
because, before sending you, I tried the same formula and it is working
- « Previous Replies
-
- 1
- 2
- Next Replies »