Unlock a world of possibilities! Login now and discover the exclusive benefits awaiting you.

- Qlik Community
- :
- All Forums
- :
- QlikView
- :
- Highlight the max expression in chart
- Subscribe to RSS Feed
- Mark Topic as New
- Mark Topic as Read
- Float this Topic for Current User
- Bookmark
- Subscribe
- Mute
- Printer Friendly Page

- Mark as New
- Bookmark
- Subscribe
- Mute
- Subscribe to RSS Feed
- Permalink
- Report Inappropriate Content
Highlight the max expression in chart
Gud Mrng Everyone,
Today I wanted to highlight my max value in the bar chart with a different colour.
For which I had created a bar chart.
Dimension: if(Match(System_Created,'CLA','GOL','LOI','QUO','SES','BUL')
Expression : Count(GID3)-Count(DISTINCT GID3)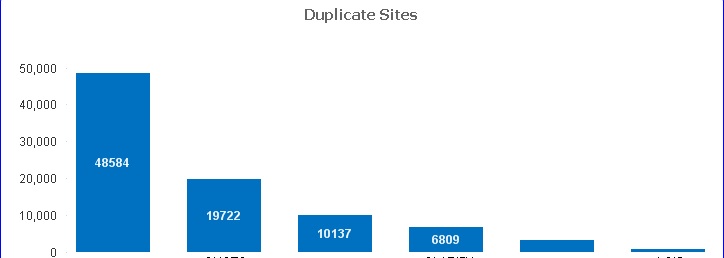
To highlighted Max bar, in another colour
Expression--Background Colour =If(Sum(Count(GID3)-Count(DISTINCT GID3)) = Max(Total Aggr(Sum(Count(GID3)-Count(DISTINCT GID3)),if(Match(System_Created,'CLA','GOL','LOI','QUO','SES','BUL'), RGB(245, 121,111), RGB(122,122,122)))))
Not getting the desired result, Can anyone help me Please?
- « Previous Replies
-
- 1
- 2
- Next Replies »


- Mark as New
- Bookmark
- Subscribe
- Mute
- Subscribe to RSS Feed
- Permalink
- Report Inappropriate Content
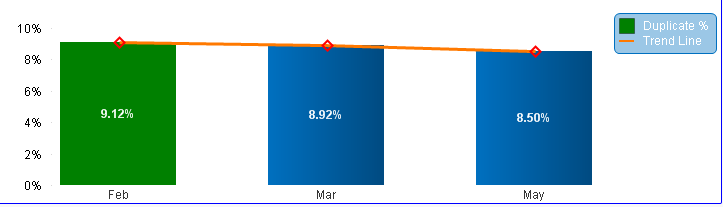
May be this?
If((Count(GID3)-Count(DISTINCT GID3))/Count(GID3) = Max(TOTAL Aggr((Count(GID3)-Count(DISTINCT GID3))/Count(GID3),Month1)), Green())
- Mark as New
- Bookmark
- Subscribe
- Mute
- Subscribe to RSS Feed
- Permalink
- Report Inappropriate Content
Thanks, Anil

 passionate
- Mark as New
- Bookmark
- Subscribe
- Mute
- Subscribe to RSS Feed
- Permalink
- Report Inappropriate Content
You can even try using:
if(Rank(Count(GID3)-Count(DISTINCT GID3))=1,Green())
In Background color of your expression
- Mark as New
- Bookmark
- Subscribe
- Mute
- Subscribe to RSS Feed
- Permalink
- Report Inappropriate Content
Some cases this won't work, I've tried many times this? But good idea 
- « Previous Replies
-
- 1
- 2
- Next Replies »