Unlock a world of possibilities! Login now and discover the exclusive benefits awaiting you.

- Qlik Community
- :
- All Forums
- :
- QlikView
- :
- How To Average Across days
Options
- Subscribe to RSS Feed
- Mark Topic as New
- Mark Topic as Read
- Float this Topic for Current User
- Bookmark
- Subscribe
- Mute
- Printer Friendly Page
Turn on suggestions
Auto-suggest helps you quickly narrow down your search results by suggesting possible matches as you type.
Showing results for

Not applicable
2015-08-21
12:00 PM
- Mark as New
- Bookmark
- Subscribe
- Mute
- Subscribe to RSS Feed
- Permalink
- Report Inappropriate Content
How To Average Across days
Hi,
I have following table that lists :
| Key | Date | Duration | Total | Utlization |
| 1 | 06/26/2013 | 0:26:00 | 0:50:00 | 52% |
| 2 | 06/26/2013 | 0:26:00 | 0:50:00 | 52% |
| 3 | 06/26/2013 | 0:26:00 | 0:50:00 | 52% |
| 4 | 06/26/2013 | 0:25:00 | 0:50:00 | 50% |
| 5 | 06/26/2013 | 0:36:00 | 0:50:00 | 72% |
| 6 | 06/26/2013 | 0:26:00 | 0:50:00 | 52% |
| 7 | 06/26/2013 | 0:26:00 | 0:50:00 | 52% |
| 1 | 06/27/2013 | 2:56:00 | 10:47:00 | 27% |
| 2 | 06/27/2013 | 2:55:00 | 10:47:00 | 27% |
| 3 | 06/27/2013 | 1:40:00 | 10:47:00 | 15% |
| 4 | 06/27/2013 | 1:40:00 | 10:47:00 | 15% |
| 5 | 06/27/2013 | 2:05:00 | 10:47:00 | 19% |
| 6 | 06/27/2013 | 1:40:00 | 10:47:00 | 15% |
| 7 | 06/27/2013 | 2:55:00 | 10:47:00 | 27% |
I created following bar chart:
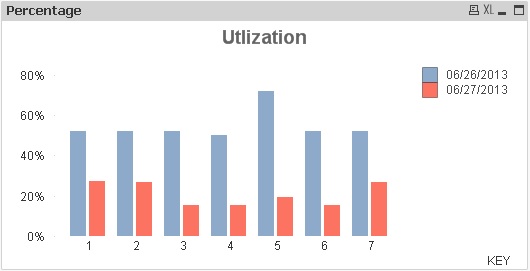
The chart shows the Utilization across Two days for each Key.
Dimensions: Key and Date
Expression: Utilization
I want to show "one" bar that is the average Utilization across two or more days based on filter selection for each Key. How can I do that? Seems simple but the plot does not work?
Thanks
- Tags:
- average across days
895 Views
1 Solution
Accepted Solutions

 Gysbert_Wassena
Partner - Champion III
2015-08-21
12:20 PM
- Mark as New
- Bookmark
- Subscribe
- Mute
- Subscribe to RSS Feed
- Permalink
- Report Inappropriate Content
Remove Date as dimension and use avg(Utilization) as expression.
talk is cheap, supply exceeds demand
756 Views
2 Replies
Gysbert_Wassena
Partner - Champion III
2015-08-21
12:20 PM
- Mark as New
- Bookmark
- Subscribe
- Mute
- Subscribe to RSS Feed
- Permalink
- Report Inappropriate Content
Remove Date as dimension and use avg(Utilization) as expression.
talk is cheap, supply exceeds demand
757 Views
Not applicable
2015-08-21
01:16 PM
Author
- Mark as New
- Bookmark
- Subscribe
- Mute
- Subscribe to RSS Feed
- Permalink
- Report Inappropriate Content
It works. Thanks.
756 Views