Unlock a world of possibilities! Login now and discover the exclusive benefits awaiting you.

- Qlik Community
- :
- All Forums
- :
- QlikView
- :
- Re: How to create a table with sum(Points) by User...
- Subscribe to RSS Feed
- Mark Topic as New
- Mark Topic as Read
- Float this Topic for Current User
- Bookmark
- Subscribe
- Mute
- Printer Friendly Page

 daniportero6
- Mark as New
- Bookmark
- Subscribe
- Mute
- Subscribe to RSS Feed
- Permalink
- Report Inappropriate Content
How to create a table with sum(Points) by User and Week
Hi everyone,
I need some help with a problem that I have with a table on Qlikview.
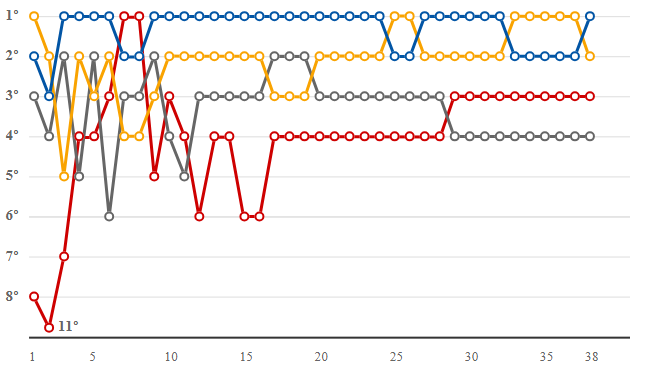
The problem is that I wanna show a graphic like this:
I have the next table:
Week, User, Points: [
1, A, 15
1, B, 7
1, C, 10
2, A, 2
2, B, 20,
2, C, 9
...
Untill week 38]
Then, I wanna show the evolution of the table (1º, 2º, 3º) by Week and user like the pic from above.
Should be with sum(Points):
week 1: { A-15, B-7, C-10}, so 1º-A, 2º-C, 3º-B
week 2: { A-17, B-27, C-19}, so 1º-B, 2º-C, 3º-A
I tryed with RangeSum(sum(Points), 0, Week)) but it did not work.
Any help please?
- Tags:
- qlikview_scripting
- « Previous Replies
-
- 1
- 2
- Next Replies »

 MarcoWedel
- Mark as New
- Bookmark
- Subscribe
- Mute
- Subscribe to RSS Feed
- Permalink
- Report Inappropriate Content
Hi again,
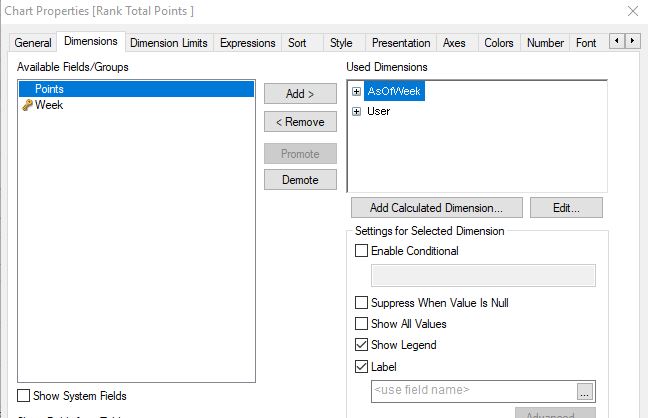
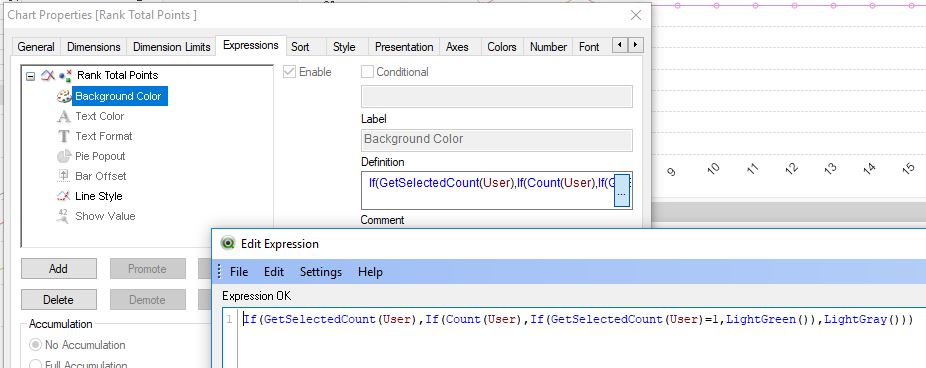
some screenshots that should help you configure your charts:
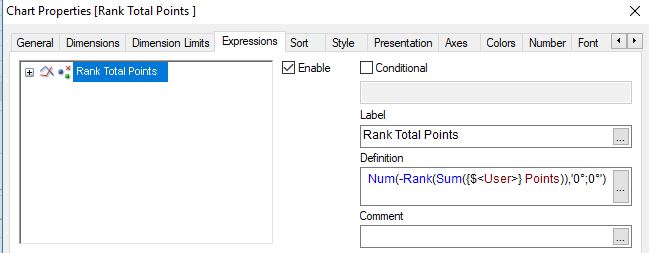
Num(-Rank(Sum({$<User>} Points)),'0°;0°')
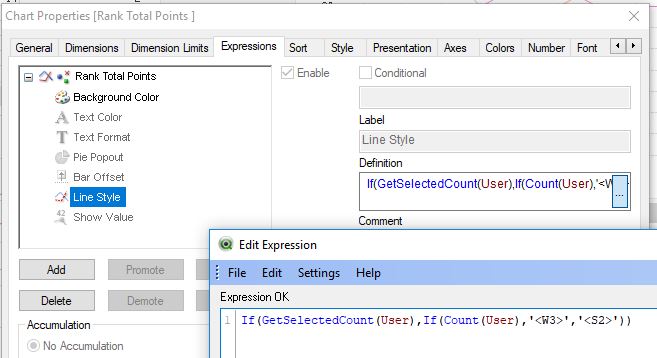
regards
Marco
daniportero6
- Mark as New
- Bookmark
- Subscribe
- Mute
- Subscribe to RSS Feed
- Permalink
- Report Inappropriate Content
Thanks you so much Marco!
Regards

- « Previous Replies
-
- 1
- 2
- Next Replies »