Unlock a world of possibilities! Login now and discover the exclusive benefits awaiting you.

- Qlik Community
- :
- All Forums
- :
- QlikView
- :
- How to cut line chart
Options
- Subscribe to RSS Feed
- Mark Topic as New
- Mark Topic as Read
- Float this Topic for Current User
- Bookmark
- Subscribe
- Mute
- Printer Friendly Page
Turn on suggestions
Auto-suggest helps you quickly narrow down your search results by suggesting possible matches as you type.
Showing results for

 eliko_il
Contributor
2013-04-03
01:14 AM
- Mark as New
- Bookmark
- Subscribe
- Mute
- Subscribe to RSS Feed
- Permalink
- Report Inappropriate Content
How to cut line chart
Hi all,
I have the following problem I'm trying to create this graph :
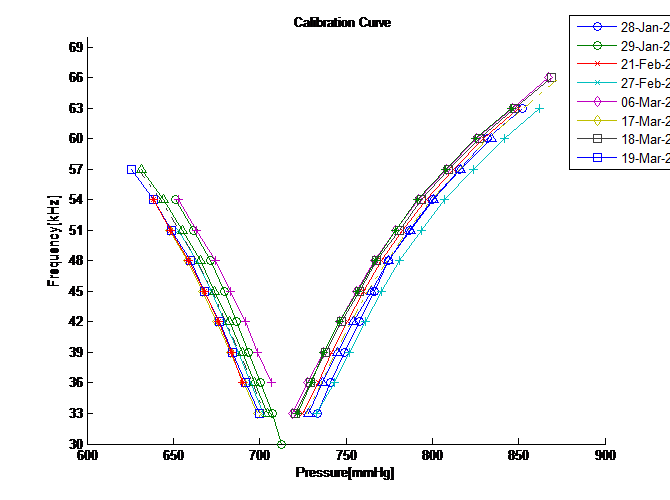
With 2 dimension and 1 expression(Frequency), I success to create this graph in qlikview:
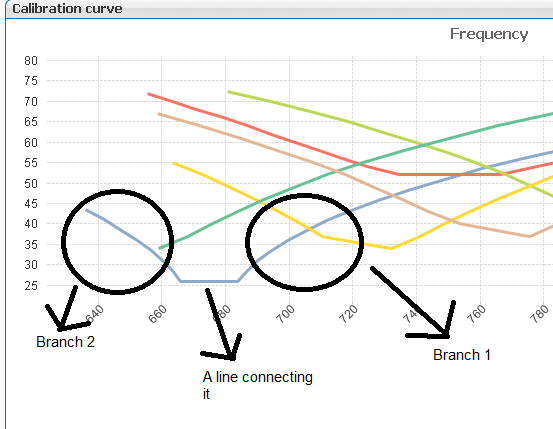
but
I need to delete the line connecting , the logic rule for branch 1 is pressure > var1 and for branch 2 is pressure < var1
when I separate to 2 expression i got good result only per one of the seconddimension but when I clear the selections the graph look like this:
(I'm losing the second dimension).
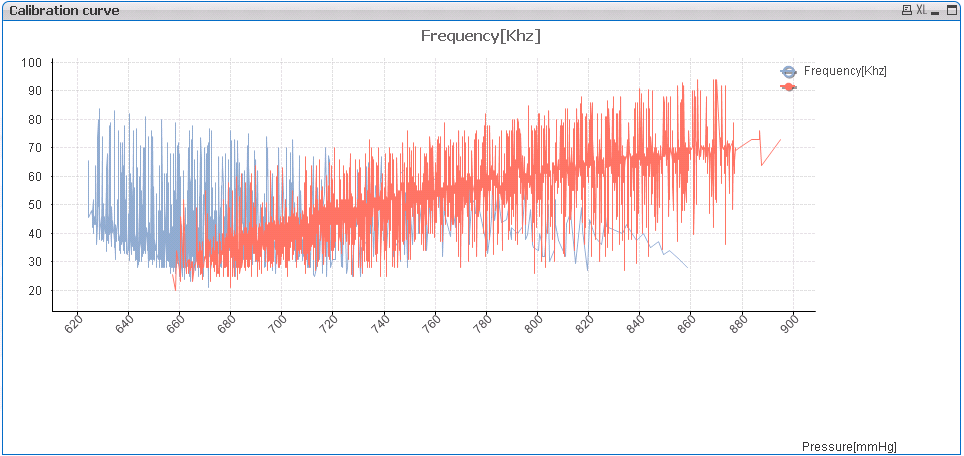
Any idea how to create chart with 2 dimension and 2 expression without losing the second dimension?
Other solution will welcome as well.
thnx.
712 Views
1 Reply

Not applicable
2013-04-03
06:16 AM
- Mark as New
- Bookmark
- Subscribe
- Mute
- Subscribe to RSS Feed
- Permalink
- Report Inappropriate Content
Hi,
Please attach your sample application.
638 Views