Unlock a world of possibilities! Login now and discover the exclusive benefits awaiting you.

- Qlik Community
- :
- All Forums
- :
- QlikView
- :
- Re: How to display Avg from calculated sum in grap...
- Subscribe to RSS Feed
- Mark Topic as New
- Mark Topic as Read
- Float this Topic for Current User
- Bookmark
- Subscribe
- Mute
- Printer Friendly Page

 ajaysingh29
- Mark as New
- Bookmark
- Subscribe
- Mute
- Subscribe to RSS Feed
- Permalink
- Report Inappropriate Content
How to display Avg from calculated sum in graphs
Hi All,
I am new to qlikview & need your help. I have data set in which I wanted to show Avg of sum in chart.
I have attached QVW. following image may help you to understand my concern.
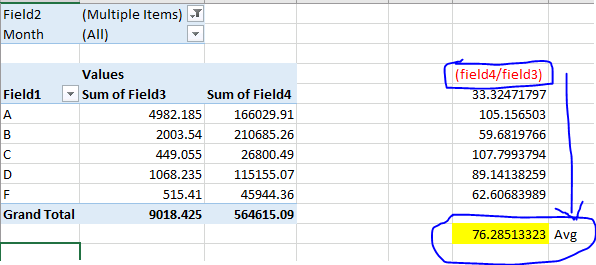
I wanted to display highlighted avg for every months.
Accepted Solutions

 sunny_talwar
- Mark as New
- Bookmark
- Subscribe
- Mute
- Subscribe to RSS Feed
- Permalink
- Report Inappropriate Content
sunny_talwar
- Mark as New
- Bookmark
- Subscribe
- Mute
- Subscribe to RSS Feed
- Permalink
- Report Inappropriate Content
Are you looking for this in the bar graph or the pivot table?
ajaysingh29
- Mark as New
- Bookmark
- Subscribe
- Mute
- Subscribe to RSS Feed
- Permalink
- Report Inappropriate Content
Hi Sunny,
I wanted to show this in bar graph.
sunny_talwar
- Mark as New
- Bookmark
- Subscribe
- Mute
- Subscribe to RSS Feed
- Permalink
- Report Inappropriate Content
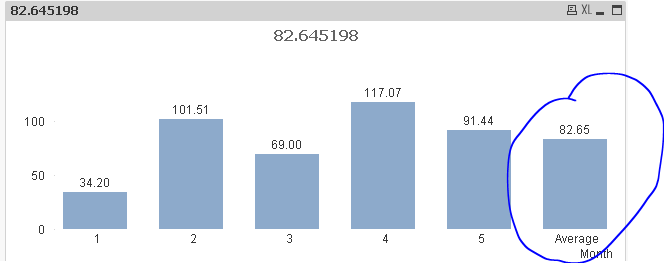
You dimension is Month in the chart, you want the overall average by Month?
ajaysingh29
- Mark as New
- Bookmark
- Subscribe
- Mute
- Subscribe to RSS Feed
- Permalink
- Report Inappropriate Content
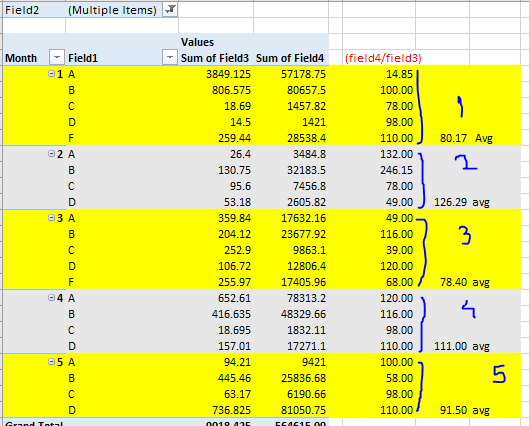
Thank you for your help Sunny. However, I wanted to show avg for each month in graph.
Please attach qvw with result.
Thanks!
sunny_talwar
- Mark as New
- Bookmark
- Subscribe
- Mute
- Subscribe to RSS Feed
- Permalink
- Report Inappropriate Content
So you will see 5 bars with 80.17 for Month 1, 126.29 for Month 2 and so on....?
ajaysingh29
- Mark as New
- Bookmark
- Subscribe
- Mute
- Subscribe to RSS Feed
- Permalink
- Report Inappropriate Content
Yes, you are correct.
For month 1 it should show 80.17, 2=>126.29, 3=>78.40,4=>111.00,5=>91.50.
kindly reply with updated qvw.
Thank you.
sunny_talwar
- Mark as New
- Bookmark
- Subscribe
- Mute
- Subscribe to RSS Feed
- Permalink
- Report Inappropriate Content
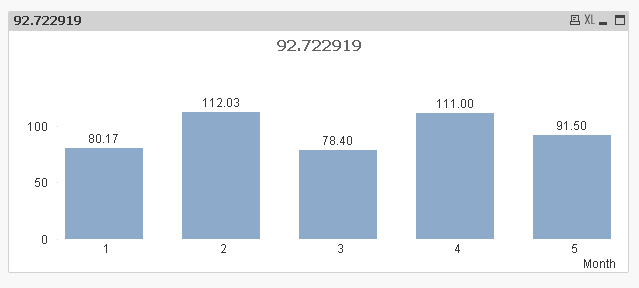
Try this:
=Avg(Aggr(Sum(Field4)/Sum(Field3), Month, Field1))
ajaysingh29
- Mark as New
- Bookmark
- Subscribe
- Mute
- Subscribe to RSS Feed
- Permalink
- Report Inappropriate Content
WOW!! Thank you so much sunny. You made my day
This forum is incredible!!!!
sunny_talwar
- Mark as New
- Bookmark
- Subscribe
- Mute
- Subscribe to RSS Feed
- Permalink
- Report Inappropriate Content
Hahahaha I am glad we were able to resolve your issue
