Unlock a world of possibilities! Login now and discover the exclusive benefits awaiting you.
- Qlik Community
- :
- All Forums
- :
- QlikView
- :
- How to show values in line chart?
- Subscribe to RSS Feed
- Mark Topic as New
- Mark Topic as Read
- Float this Topic for Current User
- Bookmark
- Subscribe
- Mute
- Printer Friendly Page
- Mark as New
- Bookmark
- Subscribe
- Mute
- Subscribe to RSS Feed
- Permalink
- Report Inappropriate Content
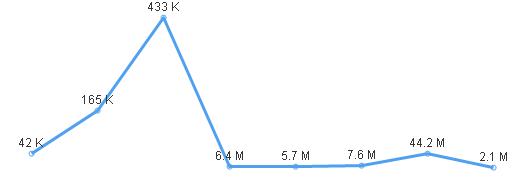
How to show values in line chart?
Hi Team,
How to show values in Million(m) foramt and thousand(k) foramts in line chart
please find the attached doc
Thanks
Accepted Solutions
- Mark as New
- Bookmark
- Subscribe
- Mute
- Subscribe to RSS Feed
- Permalink
- Report Inappropriate Content
Something like this:
if(sum(Amount)>=1000000
,num(sum(Amount)/1000000,'#,##0.0 M')
,num(sum(Amount)/1000,'#,##0 K'))
Replace sum(Amount) with the expression you use now.
talk is cheap, supply exceeds demand
- Mark as New
- Bookmark
- Subscribe
- Mute
- Subscribe to RSS Feed
- Permalink
- Report Inappropriate Content
Hi,
First thing I will do is, go to chart properties ->Number tab -> bottom right Thousand Symbol enter TH (or whatever you prefer) -> Million Symbol enter M (or whatever symbol you prefer). Then go to Expression tab then check Values on Data Points. Click OK.
Hope that helps
Regards,
Gabriel
- Mark as New
- Bookmark
- Subscribe
- Mute
- Subscribe to RSS Feed
- Permalink
- Report Inappropriate Content
PFA file, hope it helps you.
Regards,
Jagan.
- Mark as New
- Bookmark
- Subscribe
- Mute
- Subscribe to RSS Feed
- Permalink
- Report Inappropriate Content
Hi jagan,
Iam unable to open qvd file
could you post those steps
thanks
- Mark as New
- Bookmark
- Subscribe
- Mute
- Subscribe to RSS Feed
- Permalink
- Report Inappropriate Content
Something like this:
if(sum(Amount)>=1000000
,num(sum(Amount)/1000000,'#,##0.0 M')
,num(sum(Amount)/1000,'#,##0 K'))
Replace sum(Amount) with the expression you use now.
talk is cheap, supply exceeds demand
- Mark as New
- Bookmark
- Subscribe
- Mute
- Subscribe to RSS Feed
- Permalink
- Report Inappropriate Content
Hi,
Please find attached file.
Regards,
Jagan.
- Mark as New
- Bookmark
- Subscribe
- Mute
- Subscribe to RSS Feed
- Permalink
- Report Inappropriate Content
Excellent Wassennar,
Thanks
- Mark as New
- Bookmark
- Subscribe
- Mute
- Subscribe to RSS Feed
- Permalink
- Report Inappropriate Content
Hi Wassennar,
I applied your formula ,but the trend line shows above
Millions shows down trend and Thousand shows up trend
Thanks