Unlock a world of possibilities! Login now and discover the exclusive benefits awaiting you.

Announcements
Q&A with Qlik - Qlik Cloud Migration: Questions about migrating to Qlik Cloud? Catch the latest replay!
- Qlik Community
- :
- All Forums
- :
- QlikView
- :
- I have 10 expression on my bar chart and in stack,...
Options
- Subscribe to RSS Feed
- Mark Topic as New
- Mark Topic as Read
- Float this Topic for Current User
- Bookmark
- Subscribe
- Mute
- Printer Friendly Page
Turn on suggestions
Auto-suggest helps you quickly narrow down your search results by suggesting possible matches as you type.
Showing results for

Not applicable
2015-03-11
12:22 PM
- Mark as New
- Bookmark
- Subscribe
- Mute
- Subscribe to RSS Feed
- Permalink
- Report Inappropriate Content
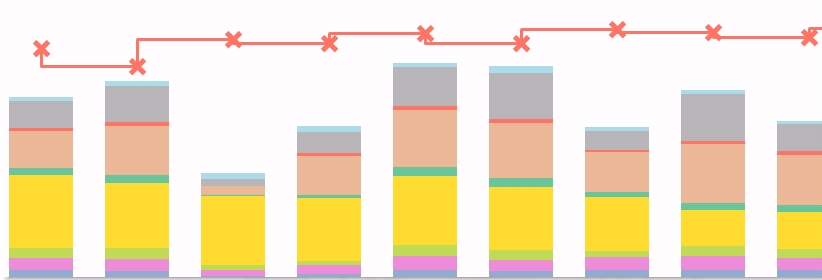
I have 10 expression on my bar chart and in stack, value refuse to show in data point
I have 10 dimension on my bar chart, i wanna show value at top of my stack but not working. what do i do?
5 Replies

 robert_mika
MVP
2015-03-11
12:29 PM
- Mark as New
- Bookmark
- Subscribe
- Mute
- Subscribe to RSS Feed
- Permalink
- Report Inappropriate Content
Could you attached your file?
615 Views
 MK_QSL
MVP
2015-03-11
12:30 PM
- Mark as New
- Bookmark
- Subscribe
- Mute
- Subscribe to RSS Feed
- Permalink
- Report Inappropriate Content
Is Values on Data points ticked for all expression?
615 Views

.png "Former Employee") JonnyPoole
JonnyPoole
Former Employee
2015-03-11
01:37 PM
- Mark as New
- Bookmark
- Subscribe
- Mute
- Subscribe to RSS Feed
- Permalink
- Report Inappropriate Content
Agree with Manish above... on the presentation tab (for a stacked scenario) you'll also have to ensure 'values in segments' is unchecked.
There was this interesting scenario recently as well, specifically to see values within the segments AND on top of the bars themselves.
615 Views
Not applicable
2015-03-13
03:28 PM
Author
- Mark as New
- Bookmark
- Subscribe
- Mute
- Subscribe to RSS Feed
- Permalink
- Report Inappropriate Content
yes all ticked
615 Views
Not applicable
2015-03-14
06:01 AM
Author
- Mark as New
- Bookmark
- Subscribe
- Mute
- Subscribe to RSS Feed
- Permalink
- Report Inappropriate Content
Hi,
go to presentation tab then check the "plot values inside segments".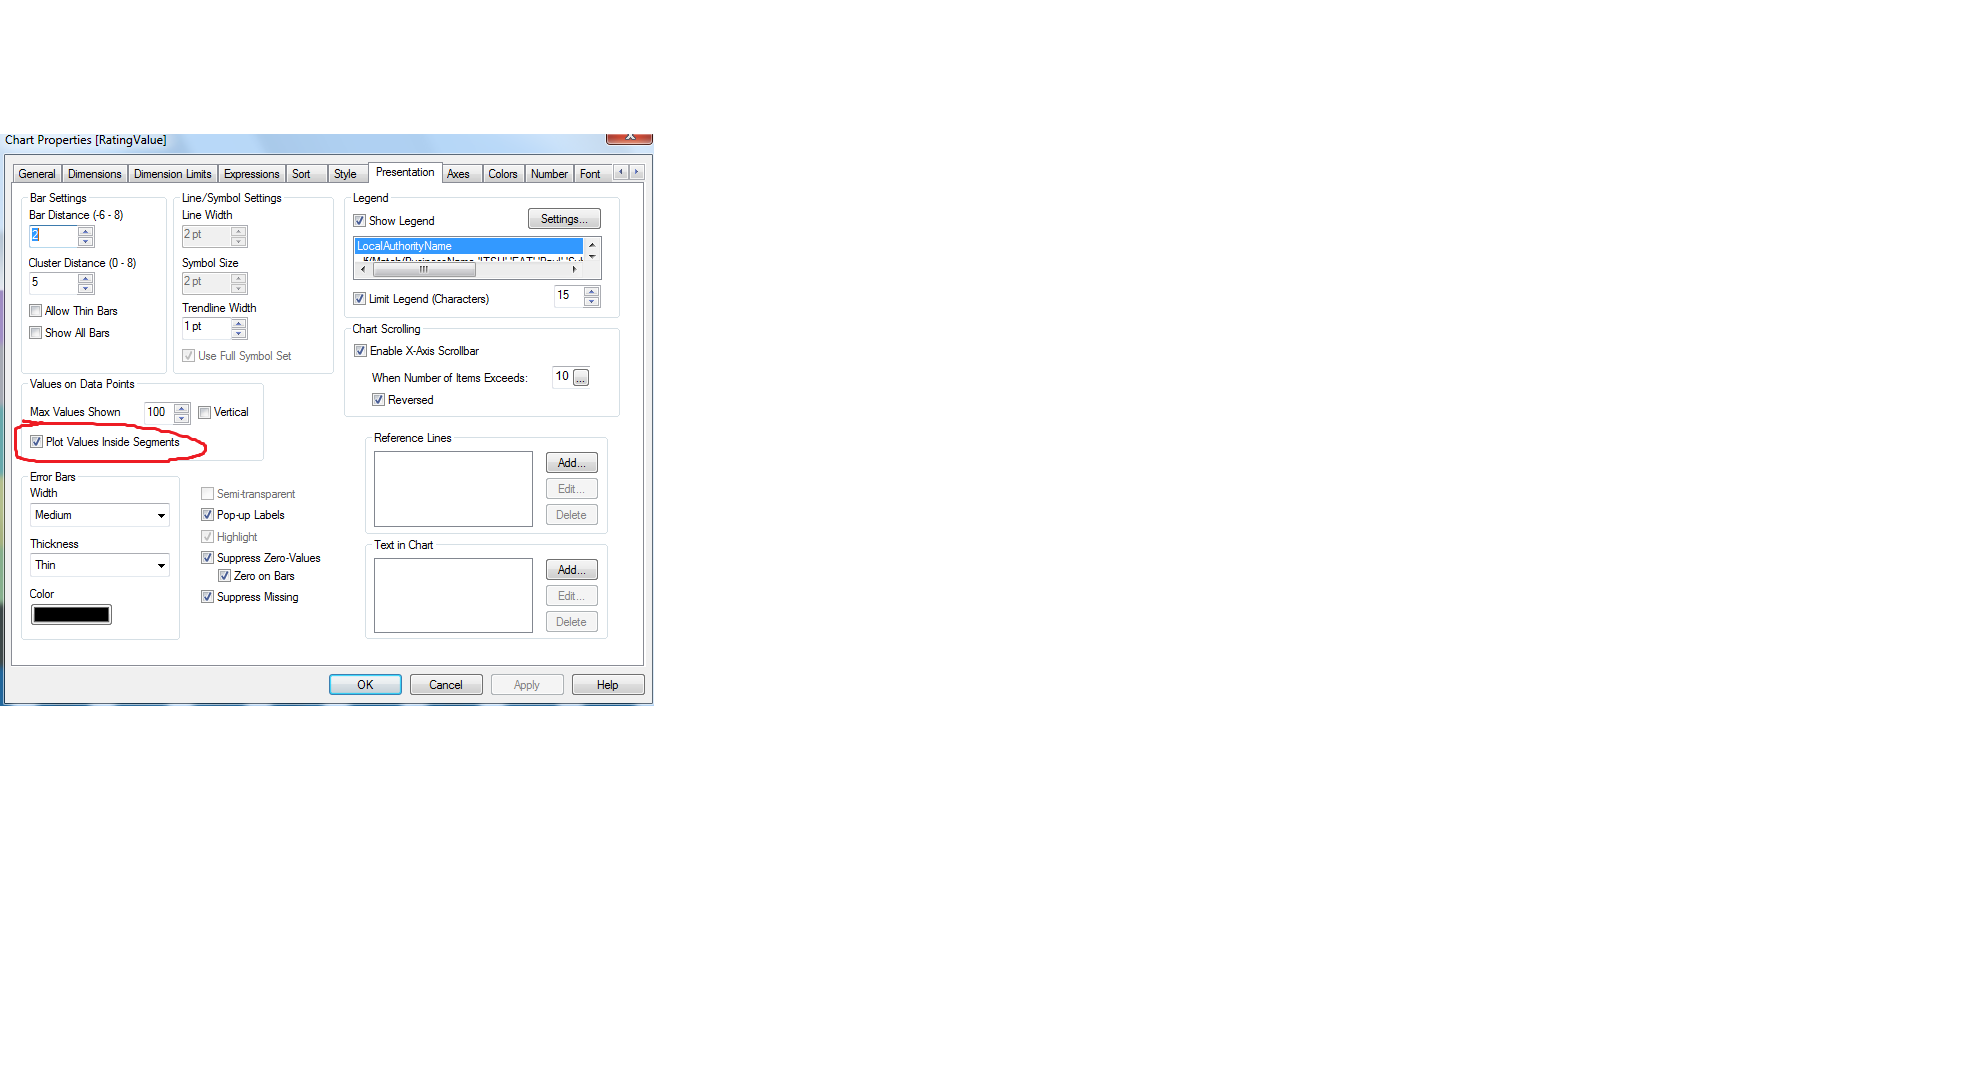
615 Views