Unlock a world of possibilities! Login now and discover the exclusive benefits awaiting you.

- Qlik Community
- :
- All Forums
- :
- QlikView
- :
- Input Field and Straight Chart
- Subscribe to RSS Feed
- Mark Topic as New
- Mark Topic as Read
- Float this Topic for Current User
- Bookmark
- Subscribe
- Mute
- Printer Friendly Page

- Mark as New
- Bookmark
- Subscribe
- Mute
- Subscribe to RSS Feed
- Permalink
- Report Inappropriate Content
Input Field and Straight Chart
HI All,
i have a straight chart.
Dimension -- Details_Drill : Region-Plan-Agent-Account-Location
EXpression -- Annual Loss Ratio : if(len(vInput=0, sum({<Y_Q={"$(=max(Y_Q))"}>}AnnualLoss) / sum({<Y_Q ={"$(=Max(Y_Q))"}>} Distinct PolicyPremium), if(((sum({<Y_Q = {"$(=max(Y_Q))"}>} AnnualLoss) / sum({<Y_Q ={"$(=Max(Y_Q))"}>} Distinct PolicyPremium))*100)>=(vInput), sum({<Y_Q={"$(=max(Y_Q))"}>}AnnualLoss) / sum({<Y_Q ={"$(=Max(Y_Q))"}>} Distinct PolicyPremium)))
now, when input any value say 10 then only those Region should reflect which has values greater than 10% rest having - should not b displayed. Also, when I select any Region, the chart should drill to Plan then to Agent so on.
if u c the image, aggregation is happening on Top level n as u Drill inside the values are coming correct.

 sunny_talwar
- Mark as New
- Bookmark
- Subscribe
- Mute
- Subscribe to RSS Feed
- Permalink
- Report Inappropriate Content
I don't see any image here, did you forget to add one?
- Mark as New
- Bookmark
- Subscribe
- Mute
- Subscribe to RSS Feed
- Permalink
- Report Inappropriate Content
i added don't know y it didn't get reflected. Anyway..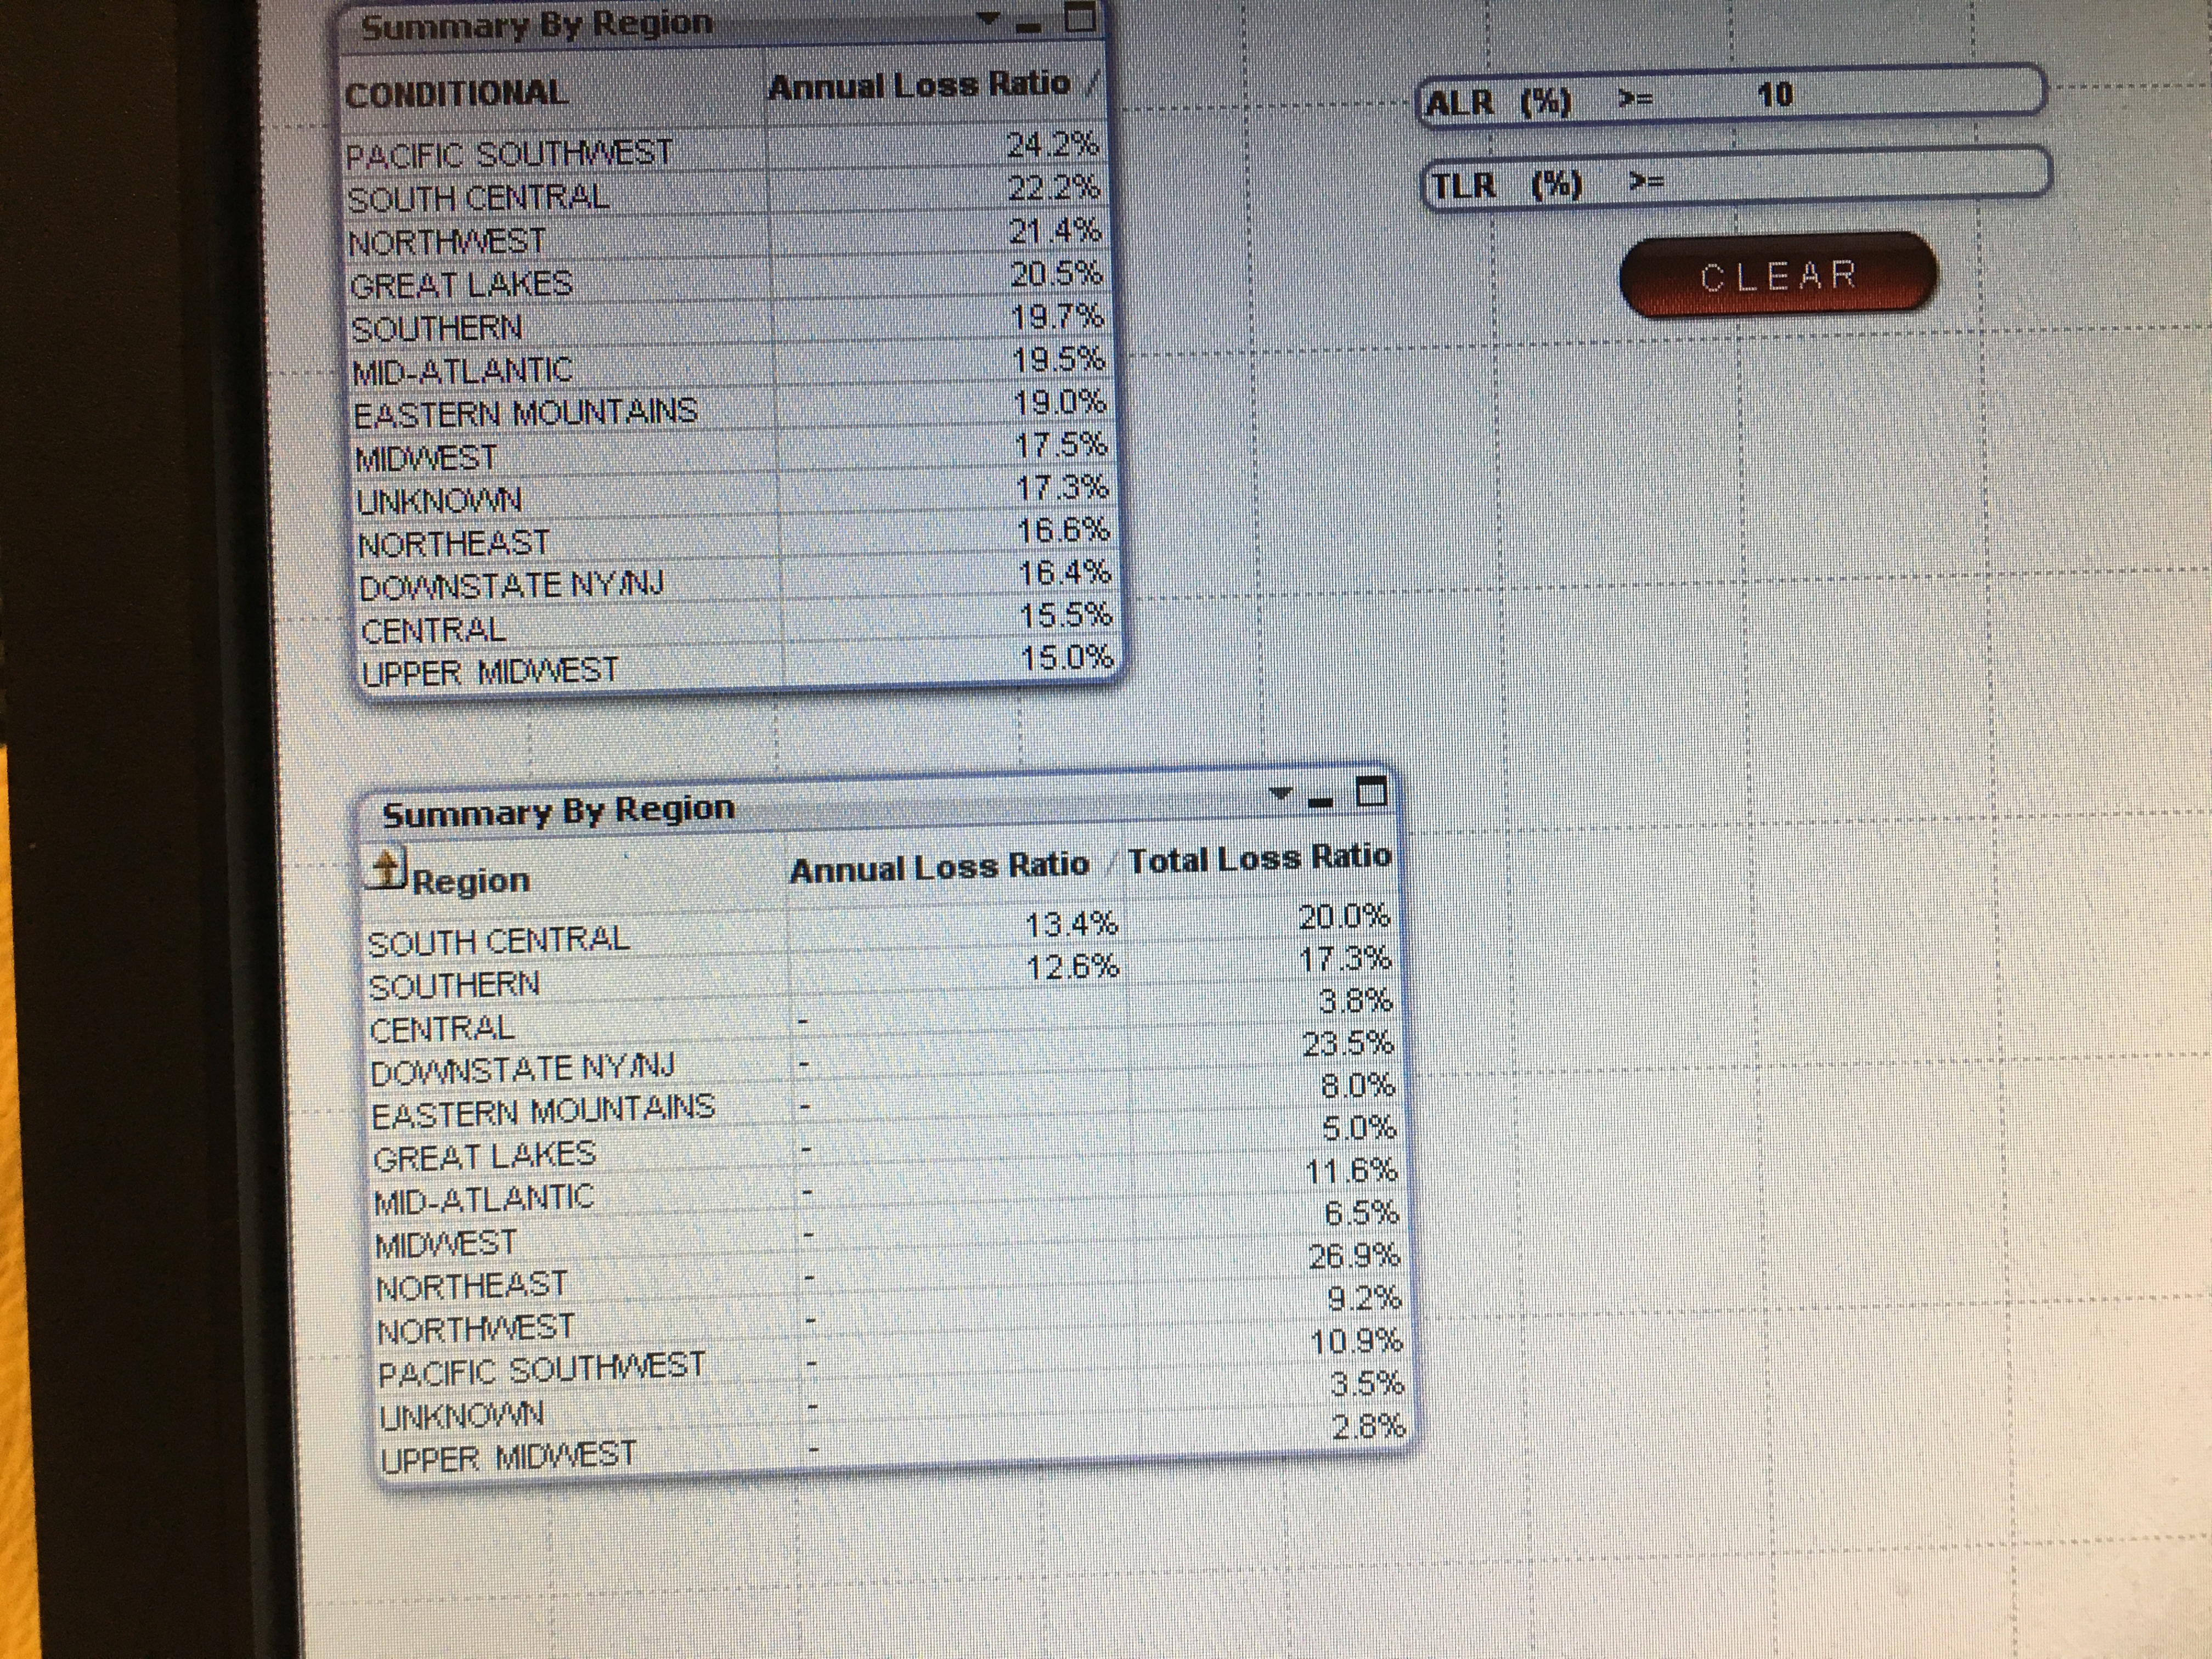
sunny_talwar
- Mark as New
- Bookmark
- Subscribe
- Mute
- Subscribe to RSS Feed
- Permalink
- Report Inappropriate Content
I believe that you need to use Aggr() function to perform your if expression check.
If(Len(vInput=0, Sum({<Y_Q={"$(=max(Y_Q))"}>}AnnualLoss) / Sum({<Y_Q ={"$(=Max(Y_Q))"}>} DISTINCT PolicyPremium),
Sum(Aggr(
If(((Sum({<Y_Q = {"$(=max(Y_Q))"}>} AnnualLoss)/Sum({<Y_Q ={"$(=Max(Y_Q))"}>} DISTINCT PolicyPremium))*100)>=(vInput), Sum({<Y_Q={"$(=max(Y_Q))"}>}AnnualLoss)
, Region, Plant, Agent, Account, Location))
/ Sum({<Y_Q ={"$(=Max(Y_Q))"}>} DISTINCT PolicyPremium)))