Unlock a world of possibilities! Login now and discover the exclusive benefits awaiting you.

- Qlik Community
- :
- All Forums
- :
- QlikView
- :
- Issue on Graph
- Subscribe to RSS Feed
- Mark Topic as New
- Mark Topic as Read
- Float this Topic for Current User
- Bookmark
- Subscribe
- Mute
- Printer Friendly Page

 qlikviewaf
- Mark as New
- Bookmark
- Subscribe
- Mute
- Subscribe to RSS Feed
- Permalink
- Report Inappropriate Content
Issue on Graph
Hi Guys,
i have a simple report table, where the user have to select the Measure and Dimension that would like to see.
The thing is that for the "Measure", there's something that sometimes doesn't work. Here below an example:
User has selected "Costs PY" but as you can see on the report also appears "Sales" as measure.
Anyone knows where is the bug ?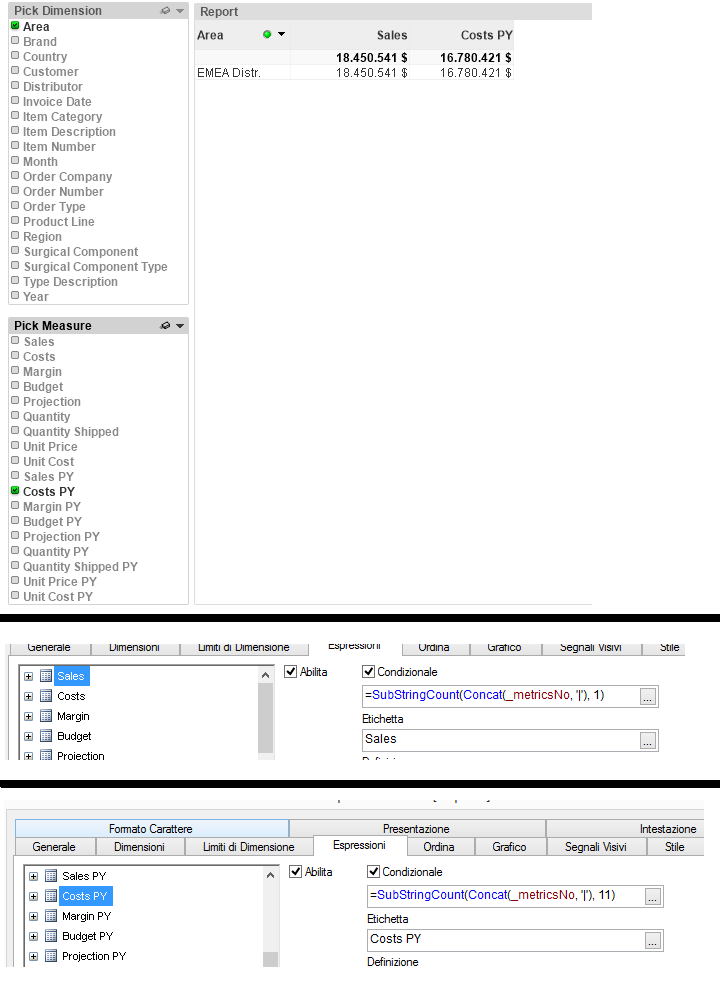
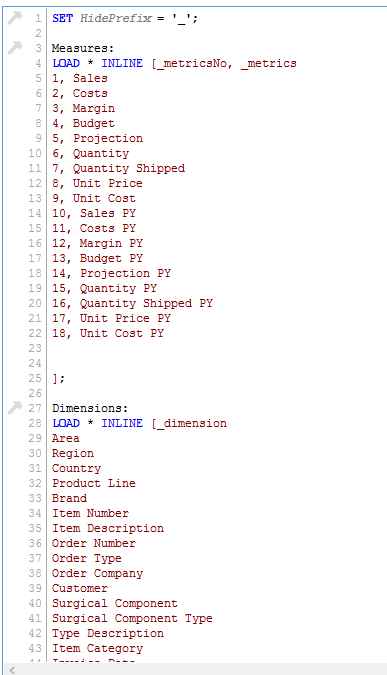
Here how the script is build
Accepted Solutions

 sunny_talwar
- Mark as New
- Bookmark
- Subscribe
- Mute
- Subscribe to RSS Feed
- Permalink
- Report Inappropriate Content
The problem is that 1 is also part of 11, so when you select Cost PY, Sales comes for free... change all your conditional expressions to this
Sales
=SubStringCount(Concat('|' & _metricsNo & '|'), '|1|')
Cost PY
=SubStringCount(Concat('|' & _metricsNo & '|'), '|11|')
etc...
sunny_talwar
- Mark as New
- Bookmark
- Subscribe
- Mute
- Subscribe to RSS Feed
- Permalink
- Report Inappropriate Content
The problem is that 1 is also part of 11, so when you select Cost PY, Sales comes for free... change all your conditional expressions to this
Sales
=SubStringCount(Concat('|' & _metricsNo & '|'), '|1|')
Cost PY
=SubStringCount(Concat('|' & _metricsNo & '|'), '|11|')
etc...
