Unlock a world of possibilities! Login now and discover the exclusive benefits awaiting you.

- Qlik Community
- :
- All Forums
- :
- QlikView
- :
- Issue with Line graph in Combo chart
- Subscribe to RSS Feed
- Mark Topic as New
- Mark Topic as Read
- Float this Topic for Current User
- Bookmark
- Subscribe
- Mute
- Printer Friendly Page

- Mark as New
- Bookmark
- Subscribe
- Mute
- Subscribe to RSS Feed
- Permalink
- Report Inappropriate Content
Issue with Line graph in Combo chart
So I have a combo chart that has a bar graph and a line graph.
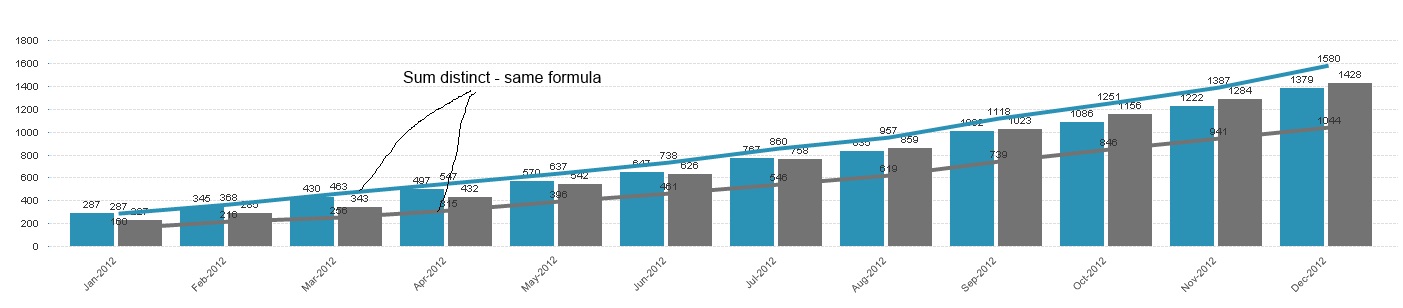
The bar graph gives me a count of X for each month. The line chart gives me a distinct count of X over time.
I have 2 bar graphs one for product X & one for product Y and I have 2 corresponding line graphs for distinct sum.
Here is the issue - the line chart for product X works fine - checked out. The one for product Y does not. They are using the same formula (as below)
if(product_key=3,SUM(AGGR(count({$<[market_data]={'Published'}>} application_key),application_key)))
The only difference is the value of product_key.
Anyone have any ideas why one would work and not the other?
Here is the way the graph looks: