Unlock a world of possibilities! Login now and discover the exclusive benefits awaiting you.

- Qlik Community
- :
- All Forums
- :
- QlikView
- :
- Label graph with many Dimensions without Legend
- Subscribe to RSS Feed
- Mark Topic as New
- Mark Topic as Read
- Float this Topic for Current User
- Bookmark
- Subscribe
- Mute
- Printer Friendly Page

- Mark as New
- Bookmark
- Subscribe
- Mute
- Subscribe to RSS Feed
- Permalink
- Report Inappropriate Content
Label graph with many Dimensions without Legend
Hello
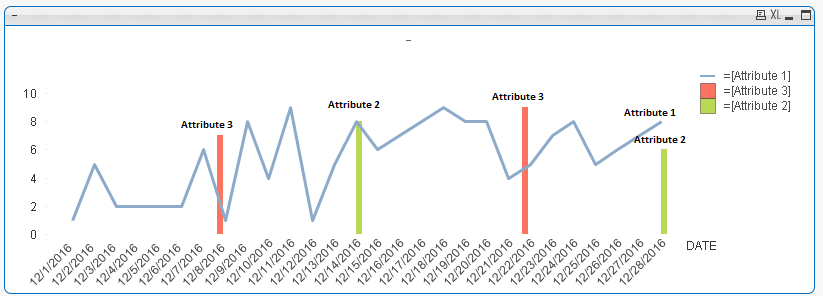
In contrast to How to show legend/data label directly in chart area?, I want to label many Dimensions on the graph, instead of having a Legend. I tried all codes mentioned on forums, but not getting desired results.
Thanks!

 rwunderlich
- Mark as New
- Bookmark
- Subscribe
- Mute
- Subscribe to RSS Feed
- Permalink
- Report Inappropriate Content
Modify your expressions to be Dual() like this:
=Dual('Attribute 2',[Attribute 2])
-Rob
- Mark as New
- Bookmark
- Subscribe
- Mute
- Subscribe to RSS Feed
- Permalink
- Report Inappropriate Content
Hello Rob
Thank you for helping me out.
It worked for Attribute 2 & 3.
As for Attribute 1 (line chart), I am trying to write the following:
=dual(if(DATE=max(DATE),'Attribute1',''),[Attribute 1]) .
But if is labeling each data point with 'Attribute1', instead of labeling just the last one.
rwunderlich
- Mark as New
- Bookmark
- Subscribe
- Mute
- Subscribe to RSS Feed
- Permalink
- Report Inappropriate Content
=dual(if(DATE=max(TOTAL DATE),'Attribute1',''),[Attribute 1]) .