Unlock a world of possibilities! Login now and discover the exclusive benefits awaiting you.
- Qlik Community
- :
- All Forums
- :
- QlikView
- :
- Re: Last 7 days average barchart
- Subscribe to RSS Feed
- Mark Topic as New
- Mark Topic as Read
- Float this Topic for Current User
- Bookmark
- Subscribe
- Mute
- Printer Friendly Page
- Mark as New
- Bookmark
- Subscribe
- Mute
- Subscribe to RSS Feed
- Permalink
- Report Inappropriate Content
Last 7 days average barchart
I`m trying to calculate last 7 days average of sales and put it in a bar chart , but when I add the expression it shows values for every day. I want to show just one bar for the average.
This is the expression:
sum({<DATE = {">=$(=Date(GetFieldSelections(DATE)-7))<=$(=Date(GetFieldSelections(DATE)))"}>} Sales) / 8
What is wrong , or what am I doning wrong?
Thank you
- « Previous Replies
-
- 1
- 2
- Next Replies »
- Mark as New
- Bookmark
- Subscribe
- Mute
- Subscribe to RSS Feed
- Permalink
- Report Inappropriate Content
aggr(sum({<DATE = {'>=$(vMaxDatePrev)<=$(vMaxDate)'}>} Sales) / 8, Week)
- Mark as New
- Bookmark
- Subscribe
- Mute
- Subscribe to RSS Feed
- Permalink
- Report Inappropriate Content
Could you share one example of your app plz?
- Mark as New
- Bookmark
- Subscribe
- Mute
- Subscribe to RSS Feed
- Permalink
- Report Inappropriate Content
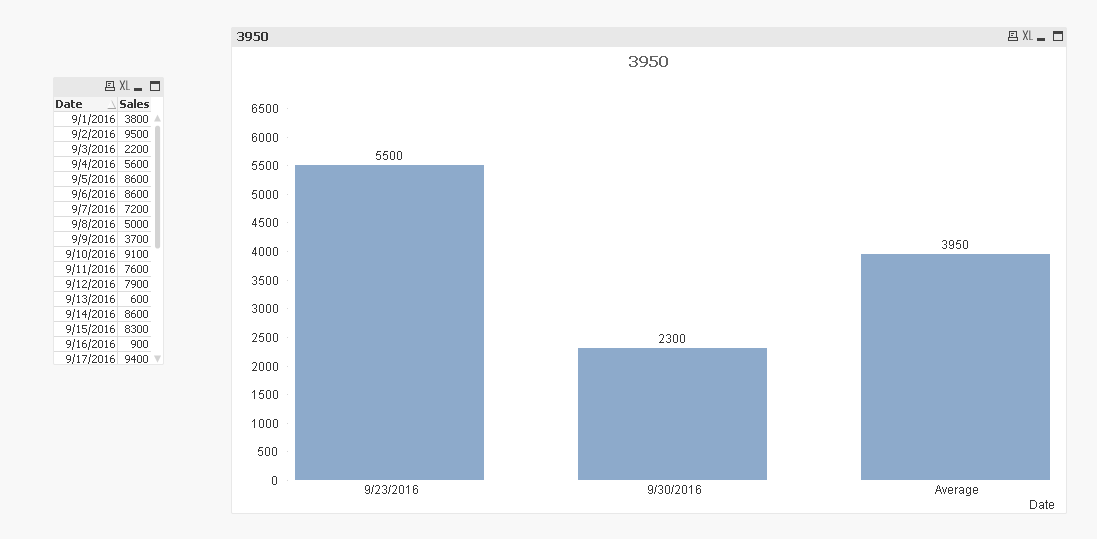
Are you looking for something like this?
- Mark as New
- Bookmark
- Subscribe
- Mute
- Subscribe to RSS Feed
- Permalink
- Report Inappropriate Content
I don`t understand why it shows me only two bars , the one for today and the one for 7 days ago , but the average is not shown 
this is the exact query that I wrote
=If(Dimensionality() = 0,
Avg({<DATE = {"$(='>=' & Date(Max(DATE)-7) & '<=' & Date(Max(DATE)))"}, LEVEL1={'Electronics'}>}if(CUST_TYPE='P',SALES,SALES*-1)),
Sum({<DATE = {"$(=Date(Max(DATE)-7))", "$(=Date(Max(DATE)))"}, LEVEL1={'Electronics'}>}if(CUST_TYPE='P',SALES,SALES*-1)))
- Mark as New
- Bookmark
- Subscribe
- Mute
- Subscribe to RSS Feed
- Permalink
- Report Inappropriate Content
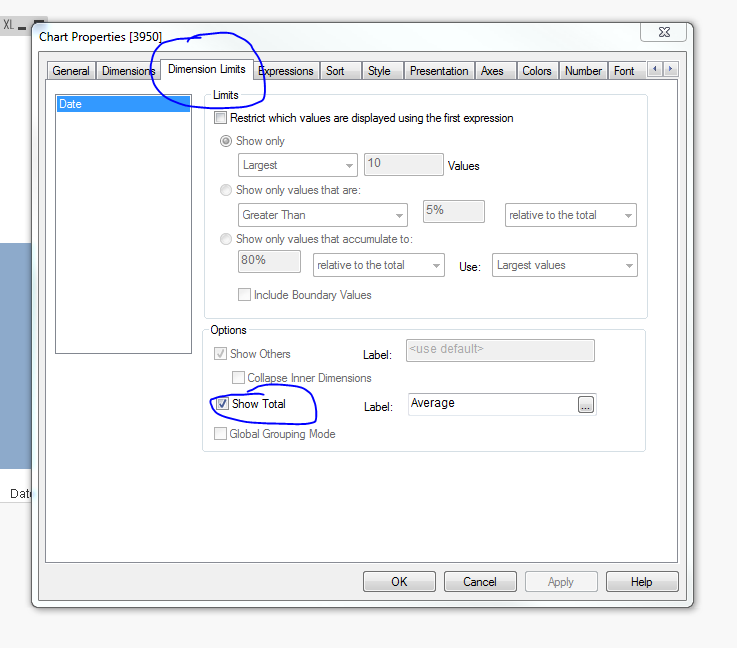
Apologize, I should have pointed that out. Select 'Show Total' on the dimension limits tab
- « Previous Replies
-
- 1
- 2
- Next Replies »