Unlock a world of possibilities! Login now and discover the exclusive benefits awaiting you.
- Qlik Community
- :
- All Forums
- :
- QlikView
- :
- Re: Re: Re: Re: Legend at the Bottom
- Subscribe to RSS Feed
- Mark Topic as New
- Mark Topic as Read
- Float this Topic for Current User
- Bookmark
- Subscribe
- Mute
- Printer Friendly Page
- Mark as New
- Bookmark
- Subscribe
- Mute
- Subscribe to RSS Feed
- Permalink
- Report Inappropriate Content
Legend at the Bottom
Hello,
In any graph, is there any way to put the legend atthe bottom of the graph instead of at the right (default) ?
thanks,
dani
- Tags:
- new_to_qlikview
- « Previous Replies
-
- 1
- 2
- Next Replies »
- Mark as New
- Bookmark
- Subscribe
- Mute
- Subscribe to RSS Feed
- Permalink
- Report Inappropriate Content
What you are describing may be better done as a grid chart. That way you can compare the interactions between the 2 dimensions. I often use this chart when I have multiple dimensions with equal significance.
- Mark as New
- Bookmark
- Subscribe
- Mute
- Subscribe to RSS Feed
- Permalink
- Report Inappropriate Content
If I open in my PC, it will work....
Which version you are using ?
Post screenshot of your graph..
- Mark as New
- Bookmark
- Subscribe
- Mute
- Subscribe to RSS Feed
- Permalink
- Report Inappropriate Content
Here you have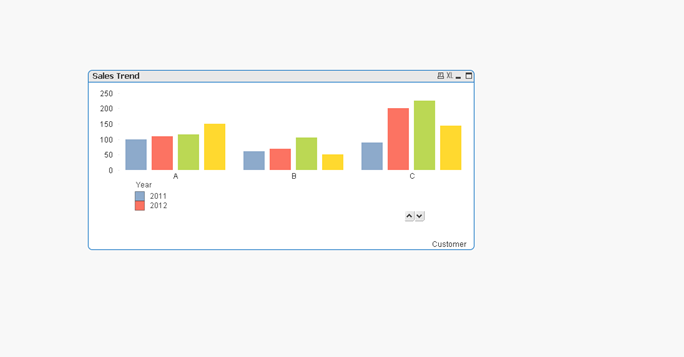
- Mark as New
- Bookmark
- Subscribe
- Mute
- Subscribe to RSS Feed
- Permalink
- Report Inappropriate Content
This is what I have loaded. How exactly you want?
- Mark as New
- Bookmark
- Subscribe
- Mute
- Subscribe to RSS Feed
- Permalink
- Report Inappropriate Content
well... I want the 2011, 2012, 2013, 2014 to be displayed one to each other instead of one below the other.
in other words what I want is:
2011 2012 2013 2014
what I don't want is:
2011
2012
2013
2014
thanks Manish !
- Mark as New
- Bookmark
- Subscribe
- Mute
- Subscribe to RSS Feed
- Permalink
- Report Inappropriate Content
Enclosed..
- Mark as New
- Bookmark
- Subscribe
- Mute
- Subscribe to RSS Feed
- Permalink
- Report Inappropriate Content
This is what I was looking for. Thanks Manish.
- « Previous Replies
-
- 1
- 2
- Next Replies »