Unlock a world of possibilities! Login now and discover the exclusive benefits awaiting you.

- Qlik Community
- :
- All Forums
- :
- QlikView
- :
- Line Chart / Mountain Chart Combo
- Subscribe to RSS Feed
- Mark Topic as New
- Mark Topic as Read
- Float this Topic for Current User
- Bookmark
- Subscribe
- Mute
- Printer Friendly Page

- Mark as New
- Bookmark
- Subscribe
- Mute
- Subscribe to RSS Feed
- Permalink
- Report Inappropriate Content
Line Chart / Mountain Chart Combo
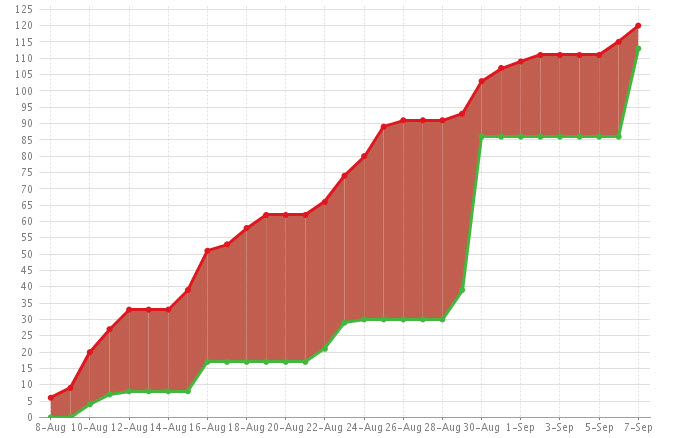
I need to create a line chart that has 2 measures, open and close issues. I need to color/shade the area between the measures. Is this chart possible to create in QV ? I am looking at using a mountain chart but I'm not able to achieve the desired color results as attached.
Any idea ?
- « Previous Replies
-
- 1
- 2
- Next Replies »
- Mark as New
- Bookmark
- Subscribe
- Mute
- Subscribe to RSS Feed
- Permalink
- Report Inappropriate Content
Great stuff Guys ! Thanks for sharing.
- Mark as New
- Bookmark
- Subscribe
- Mute
- Subscribe to RSS Feed
- Permalink
- Report Inappropriate Content
Could you please explain in more detail how to use/define the 4 expressions? Because I am not able to open your attached file. Please specify how to colour the area between two curves.
Any help will be appreciated.

 sicilianif
- Mark as New
- Bookmark
- Subscribe
- Mute
- Subscribe to RSS Feed
- Permalink
- Report Inappropriate Content
Expression 1 (creates white space at the bottom) - The expression would be the value for the fist line -1. You would make the color white.
Expression 2 (first line) - This is your line expression.
Expression 3 (creates color between) - This would be the second line value -1.
Expression 4 (second line) - This is your second line expression.
- « Previous Replies
-
- 1
- 2
- Next Replies »