Unlock a world of possibilities! Login now and discover the exclusive benefits awaiting you.

- Qlik Community
- :
- All Forums
- :
- QlikView
- :
- Line Chart Problem
- Subscribe to RSS Feed
- Mark Topic as New
- Mark Topic as Read
- Float this Topic for Current User
- Bookmark
- Subscribe
- Mute
- Printer Friendly Page

- Mark as New
- Bookmark
- Subscribe
- Mute
- Subscribe to RSS Feed
- Permalink
- Report Inappropriate Content
Line Chart Problem
Hello everyone,
I am having a problem creating a line chart.
I have this table:
| Code | Expression |
|---|---|
| A | 42551,534457604 |
| B | 42562,565512002 |
| C | 42569,561164005 |
| D | 42577,518640278 |
My expression is : = Max(aggr(Max({$<status={'running'}>}Max_ClientStatus_Time),code)).
My dimension is code.
And i am obtainning this results:
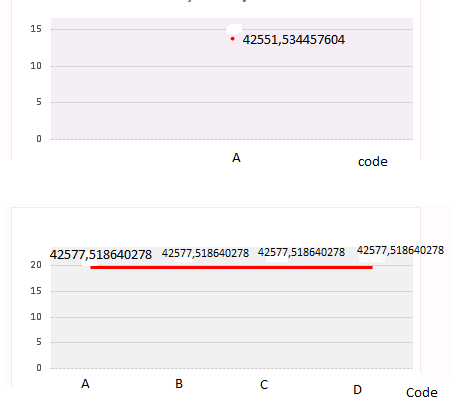
when I choose one code, it gives me the right result, when I don't select any code it gives me the max value to all codes. I can't understand why. Can anyone help me?
Greetings !
Accepted Solutions

 sunny_talwar
- Mark as New
- Bookmark
- Subscribe
- Mute
- Subscribe to RSS Feed
- Permalink
- Report Inappropriate Content
Do you have another dimension? If code is your only dimension, why don't you need Aggr() function here? can you try this:
Max({$<status={'running'}>}Max_ClientStatus_Time)
sunny_talwar
- Mark as New
- Bookmark
- Subscribe
- Mute
- Subscribe to RSS Feed
- Permalink
- Report Inappropriate Content
Do you have another dimension? If code is your only dimension, why don't you need Aggr() function here? can you try this:
Max({$<status={'running'}>}Max_ClientStatus_Time)
- Mark as New
- Bookmark
- Subscribe
- Mute
- Subscribe to RSS Feed
- Permalink
- Report Inappropriate Content
It worked using the expression Max({$<status={'running'}>}Max_ClientStatus_Time).
Thanks for the help Sunny T.