Unlock a world of possibilities! Login now and discover the exclusive benefits awaiting you.

- Qlik Community
- :
- All Forums
- :
- QlikView
- :
- Line Graph Display previous years on selection
Options
- Subscribe to RSS Feed
- Mark Topic as New
- Mark Topic as Read
- Float this Topic for Current User
- Bookmark
- Subscribe
- Mute
- Printer Friendly Page
Turn on suggestions
Auto-suggest helps you quickly narrow down your search results by suggesting possible matches as you type.
Showing results for

Not applicable
2015-06-12
04:41 PM
- Mark as New
- Bookmark
- Subscribe
- Mute
- Subscribe to RSS Feed
- Permalink
- Report Inappropriate Content
Line Graph Display previous years on selection
I have loaded data and attached a Qlik file that keeps a running count of total "cases" displayed year over year in line a graph.
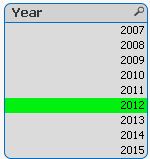
I am looking for a way on to mimic the default behavior of the line graph on user selection of year (ie show selected year with 3 or 4 years prior data).
One workaround I know of is writing different expression for each year (max(year)-1) etc.. in bar graph mode. But i was wondering if the same functionality is possible with a line graph.
Thanks all
-Tom
732 Views
1 Solution
Accepted Solutions

 MarcoWedel
MVP
2015-06-12
07:36 PM
- Mark as New
- Bookmark
- Subscribe
- Mute
- Subscribe to RSS Feed
- Permalink
- Report Inappropriate Content
548 Views
1 Reply
MarcoWedel
MVP
2015-06-12
07:36 PM
- Mark as New
- Bookmark
- Subscribe
- Mute
- Subscribe to RSS Feed
- Permalink
- Report Inappropriate Content
Hi,
one solution could be:

hope this helps
regards
Marco
549 Views