Unlock a world of possibilities! Login now and discover the exclusive benefits awaiting you.

- Qlik Community
- :
- All Forums
- :
- QlikView
- :
- Re: Line Graph
Options
- Subscribe to RSS Feed
- Mark Topic as New
- Mark Topic as Read
- Float this Topic for Current User
- Bookmark
- Subscribe
- Mute
- Printer Friendly Page
Turn on suggestions
Auto-suggest helps you quickly narrow down your search results by suggesting possible matches as you type.
Showing results for

Not applicable
2016-02-22
07:54 AM
- Mark as New
- Bookmark
- Subscribe
- Mute
- Subscribe to RSS Feed
- Permalink
- Report Inappropriate Content
Line Graph
Hi All,
I am trying to create the following line graph:
Where Number of Completed Work Orders are compared to the Avg days to complete those work orders with the points your see above.
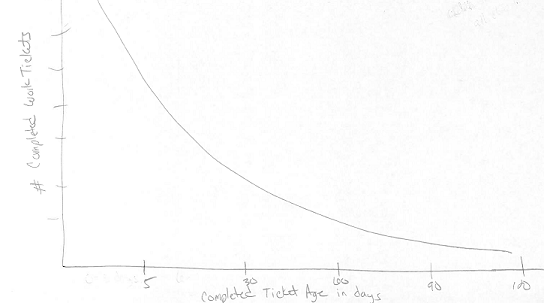
Avg Days # of Work Orders
5 100
30 76
60 40
90 20
100 10
I know I have seen this done in a post but cant locate it right now. Any help would be awesome.
Thanks,
David
2,420 Views
- « Previous Replies
-
- 1
- 2
- Next Replies »
10 Replies

 fonmarcelo
Contributor III
2016-02-23
09:05 AM
- Mark as New
- Bookmark
- Subscribe
- Mute
- Subscribe to RSS Feed
- Permalink
- Report Inappropriate Content
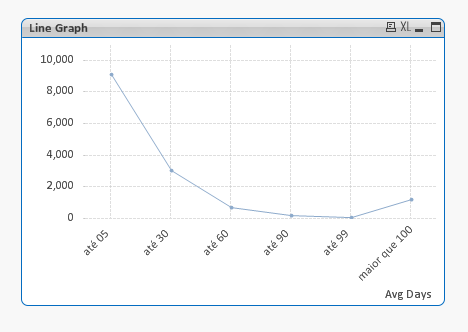
It is?
276 Views
- « Previous Replies
-
- 1
- 2
- Next Replies »