Unlock a world of possibilities! Login now and discover the exclusive benefits awaiting you.

- Qlik Community
- :
- All Forums
- :
- QlikView
- :
- Lines' intersection
- Subscribe to RSS Feed
- Mark Topic as New
- Mark Topic as Read
- Float this Topic for Current User
- Bookmark
- Subscribe
- Mute
- Printer Friendly Page

- Mark as New
- Bookmark
- Subscribe
- Mute
- Subscribe to RSS Feed
- Permalink
- Report Inappropriate Content
Lines' intersection
Hello,
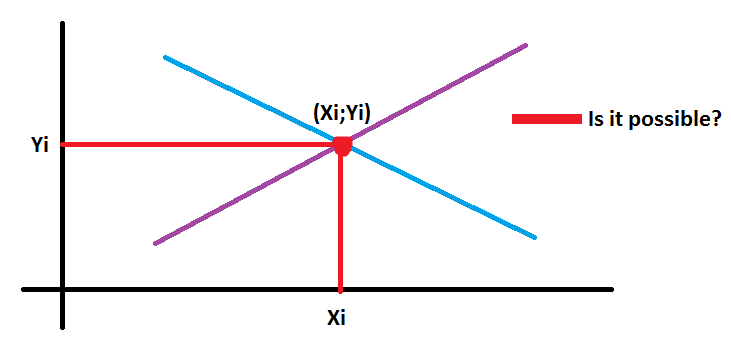
I would like to know if it is possible to highlight (maybe just add a label) the lines' intersection and draw special lines to the X and Y axes like I did in Paint.

 marcus_sommer
- Mark as New
- Bookmark
- Subscribe
- Mute
- Subscribe to RSS Feed
- Permalink
- Report Inappropriate Content
This could be possible but I think it won't be easy. The intersection-point could be a line with Xi - Yi with a condition to be visible only if the diff-value = 0. Your red-lines will be probably more difficult - you could try something similar like my suggestion for the intersection point and/or with a presentation-line from tab presentation (bottom right) and/or the trend-lines from tab expressions (bottom left) could be used.
Another (additional) approach might be to use several charts which lay over eachother (with appropriate adjustments to the layout) and/or the use from background-picture with visibility-conditions.
A further possibility could be an extension - maybe there are an existing one or one which could be adjusted to this.
- Marcus

 swuehl
- Mark as New
- Bookmark
- Subscribe
- Mute
- Subscribe to RSS Feed
- Permalink
- Report Inappropriate Content
I guess you don't know the point of intersection, nor the equation of the lines, but you are having two sets of x/ y values that define the lines or can be used for fitting lines, right?
So you would first need to calculate / determine the equations of the two lines (i.e. slope and y-axis intersection) using linest_m() and linest_b() functions in QV.
If you've got the equations (slope and intersection values), calculate the point of intersection.
Line–line intersection - Wikipedia, the free encyclopedia
If you've got the point, you can use the coordinates to draw reference lines, additional expression lines or symbols in your chart.