Unlock a world of possibilities! Login now and discover the exclusive benefits awaiting you.
- Qlik Community
- :
- All Forums
- :
- QlikView
- :
- MAKE DATA BOLD
- Subscribe to RSS Feed
- Mark Topic as New
- Mark Topic as Read
- Float this Topic for Current User
- Bookmark
- Subscribe
- Mute
- Printer Friendly Page
- Mark as New
- Bookmark
- Subscribe
- Mute
- Subscribe to RSS Feed
- Permalink
- Report Inappropriate Content
MAKE DATA BOLD
I have a pivot table with following data
Des Act Bud
Sales 100 200
Gr_profit 80 150
Exp 20 50
Net Profit 60 100
I want to appear above two rows appear in bold color. Pls help me to achieve it
Accepted Solutions
- Mark as New
- Bookmark
- Subscribe
- Mute
- Subscribe to RSS Feed
- Permalink
- Report Inappropriate Content
The same formula you have to apply for both expressions also.... Kindly check my first reply...
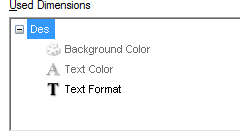
For all your dimensions and expressions, expand and get the Text Format by clicking the + sign and write below expression
- Mark as New
- Bookmark
- Subscribe
- Mute
- Subscribe to RSS Feed
- Permalink
- Report Inappropriate Content
For all your dimensions and expressions, expand and get the Text Format by clicking the + sign and write below expression
=IF(Des = 'Gr_profit' or Des = 'Net Profit','<B>')
- Mark as New
- Bookmark
- Subscribe
- Mute
- Subscribe to RSS Feed
- Permalink
- Report Inappropriate Content
Tks Manish
That will surely make text bold but not figures
- Mark as New
- Bookmark
- Subscribe
- Mute
- Subscribe to RSS Feed
- Permalink
- Report Inappropriate Content
The same formula you have to apply for both expressions also.... Kindly check my first reply...
For all your dimensions and expressions, expand and get the Text Format by clicking the + sign and write below expression
- Mark as New
- Bookmark
- Subscribe
- Mute
- Subscribe to RSS Feed
- Permalink
- Report Inappropriate Content
You can put the same function under the expression tab.
Give it a try.
- Mark as New
- Bookmark
- Subscribe
- Mute
- Subscribe to RSS Feed
- Permalink
- Report Inappropriate Content
- Mark as New
- Bookmark
- Subscribe
- Mute
- Subscribe to RSS Feed
- Permalink
- Report Inappropriate Content
Thanks all