Unlock a world of possibilities! Login now and discover the exclusive benefits awaiting you.

- Qlik Community
- :
- All Forums
- :
- QlikView
- :
- Making Y-Axis Scale on Grid Chart
- Subscribe to RSS Feed
- Mark Topic as New
- Mark Topic as Read
- Float this Topic for Current User
- Bookmark
- Subscribe
- Mute
- Printer Friendly Page

- Mark as New
- Bookmark
- Subscribe
- Mute
- Subscribe to RSS Feed
- Permalink
- Report Inappropriate Content
Making Y-Axis Scale on Grid Chart
Hi,
I have a Grid Chart with a Y-Axis that doesn't scale properly (from 0 to max value).
I have tried replicating this with a line chart (with symbols), but I haven't had much luck.
Any help is appreciated.
Thanks.

 MayilVahanan
- Mark as New
- Bookmark
- Subscribe
- Mute
- Subscribe to RSS Feed
- Permalink
- Report Inappropriate Content
Hi
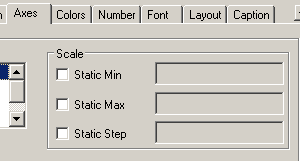
Set static min as "0" in Axes tab in properties
Hope it helps
Please close the thread by marking correct answer & give likes if you like the post.
- Mark as New
- Bookmark
- Subscribe
- Mute
- Subscribe to RSS Feed
- Permalink
- Report Inappropriate Content
Hi,
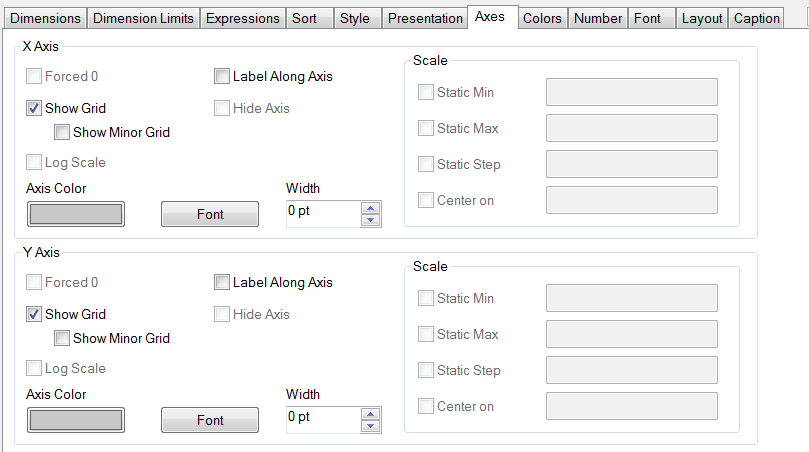
Those settings are not available in a grid chart:
MayilVahanan
- Mark as New
- Bookmark
- Subscribe
- Mute
- Subscribe to RSS Feed
- Permalink
- Report Inappropriate Content
Hi
can you post a sample file?
Please close the thread by marking correct answer & give likes if you like the post.
- Mark as New
- Bookmark
- Subscribe
- Mute
- Subscribe to RSS Feed
- Permalink
- Report Inappropriate Content
Uploaded file in original post
MayilVahanan
- Mark as New
- Bookmark
- Subscribe
- Mute
- Subscribe to RSS Feed
- Permalink
- Report Inappropriate Content
HI
PFA
Hope it helps
Please close the thread by marking correct answer & give likes if you like the post.
- Mark as New
- Bookmark
- Subscribe
- Mute
- Subscribe to RSS Feed
- Permalink
- Report Inappropriate Content
Hi,
Thanks for the help so far. So my problem from here is, I have a list of values, we'll call these A. I only want the graph to select one of the values from A and show only the points for that value.
I've attached another example in the orginal post. (samplegrid2)
Any ideas on how to pre select a certain field for a certain graph?
Thanks
MayilVahanan
- Mark as New
- Bookmark
- Subscribe
- Mute
- Subscribe to RSS Feed
- Permalink
- Report Inappropriate Content
Hi
Are you looking like attached file?
Please close the thread by marking correct answer & give likes if you like the post.