Unlock a world of possibilities! Login now and discover the exclusive benefits awaiting you.
- Qlik Community
- :
- All Forums
- :
- QlikView
- :
- Max month bar chart
- Subscribe to RSS Feed
- Mark Topic as New
- Mark Topic as Read
- Float this Topic for Current User
- Bookmark
- Subscribe
- Mute
- Printer Friendly Page
- Mark as New
- Bookmark
- Subscribe
- Mute
- Subscribe to RSS Feed
- Permalink
- Report Inappropriate Content
Max month bar chart
Hi All,
I have one chart , that chart would shows all months data but i need max month data only means one bar chart,
Pleased find the attached one.
- « Previous Replies
-
- 1
- 2
- Next Replies »
- Mark as New
- Bookmark
- Subscribe
- Mute
- Subscribe to RSS Feed
- Permalink
- Report Inappropriate Content
See attached example.
talk is cheap, supply exceeds demand
- Mark as New
- Bookmark
- Subscribe
- Mute
- Subscribe to RSS Feed
- Permalink
- Report Inappropriate Content
Hi,
In your Qlik file add Num field for Month field like
Date:
LOAD Date,
ID,
Year(Date) as Year,
Month(Date) as Month,
NUM(Month) as NumMonth,
Sales
FROM
(ooxml, embedded labels, table is Sheet1);
And in expression use it like
sum({<Year ={$(=max(Year))}, NumMonth ={$(=max(NumMonth))}>}Sales)
Regards
Anand
- Mark as New
- Bookmark
- Subscribe
- Mute
- Subscribe to RSS Feed
- Permalink
- Report Inappropriate Content
PFA...
- Mark as New
- Bookmark
- Subscribe
- Mute
- Subscribe to RSS Feed
- Permalink
- Report Inappropriate Content
Also you can use same Month field also see the attachment
And use the expression
sum({<Year ={$(=max(Year))}, Month ={$(=Month(Date#(Max(NUM(Month)),'M')))}>}Sales)
Regards
Anand
- Mark as New
- Bookmark
- Subscribe
- Mute
- Subscribe to RSS Feed
- Permalink
- Report Inappropriate Content
Hi,
Please refer attached .qvw file.
Thanks
- Mark as New
- Bookmark
- Subscribe
- Mute
- Subscribe to RSS Feed
- Permalink
- Report Inappropriate Content
Hi,
PFA.....
Regards,
Nagarjuna
- Mark as New
- Bookmark
- Subscribe
- Mute
- Subscribe to RSS Feed
- Permalink
- Report Inappropriate Content
Hi Srinivas ,
If you got your answer.Kindly close this tread.
Regards,
Nagarjuna
- Mark as New
- Bookmark
- Subscribe
- Mute
- Subscribe to RSS Feed
- Permalink
- Report Inappropriate Content
Hi nagarjuna,
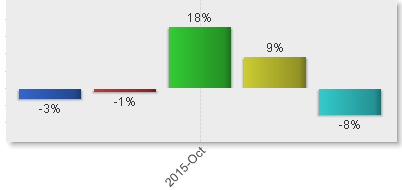
initially i want to show single bar means max month , after that according to selections i want to show all bars
like below image is showing single month data ..
if i select multiple selection then it will show multiple bars like
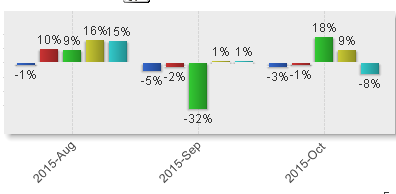
Regards
srinivas
- Mark as New
- Bookmark
- Subscribe
- Mute
- Subscribe to RSS Feed
- Permalink
- Report Inappropriate Content
You can achieve this,
PFA below atttached,
In that If you did nit select any month it will only max Month data only, if you select months accordingly it give .
_Nagarjuna
- « Previous Replies
-
- 1
- 2
- Next Replies »