Unlock a world of possibilities! Login now and discover the exclusive benefits awaiting you.

- Qlik Community
- :
- All Forums
- :
- QlikView
- :
- Mean Range
- Subscribe to RSS Feed
- Mark Topic as New
- Mark Topic as Read
- Float this Topic for Current User
- Bookmark
- Subscribe
- Mute
- Printer Friendly Page

- Mark as New
- Bookmark
- Subscribe
- Mute
- Subscribe to RSS Feed
- Permalink
- Report Inappropriate Content
Mean Range
I am trying to develop an I-MR control chart. Part of that involves calculating the mean range from a moving range. I was able to create a straight chart with the moving range (I do have null values in my data). However, I am not able to calculate the mean of the ranges. The mean should be 41.33, but QlikView just shows me a blank column. I will also at some point want to turn this into a line chart and am unsure how to do that. Also, I would like the straight table not to show the Candidate, but each time I do that I get a blank chart.
I appreciate any help on this. I've attached what I have completed so far.
Thanks!
Accepted Solutions

 sunny_talwar
- Mark as New
- Bookmark
- Subscribe
- Mute
- Subscribe to RSS Feed
- Permalink
- Report Inappropriate Content
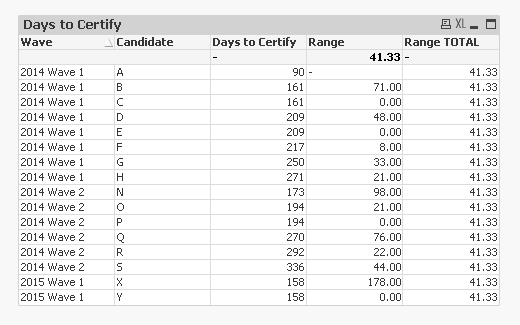
Try this:
=If([Days to Certify] > 0, Avg(TOTAL Aggr(Fabs(interval(only({<Certified?={'Y'}>}[Certification Date])-only({<Certified?={'Y'}>}[Training Date]),'d')-
Above(total interval(only({<Certified?={'Y'}>}[Certification Date])-only({<Certified?={'Y'}>}[Training Date]),'d'))), Wave, Candidate)))
sunny_talwar
- Mark as New
- Bookmark
- Subscribe
- Mute
- Subscribe to RSS Feed
- Permalink
- Report Inappropriate Content
This may be:
sunny_talwar
- Mark as New
- Bookmark
- Subscribe
- Mute
- Subscribe to RSS Feed
- Permalink
- Report Inappropriate Content
Alternatively try this expression:
=Avg(Aggr(Fabs(interval(only({<Certified?={'Y'}>}[Certification Date])-only({<Certified?={'Y'}>}[Training Date]),'d')-
Above(total interval(only({<Certified?={'Y'}>}[Certification Date])-only({<Certified?={'Y'}>}[Training Date]),'d'))), Wave, Candidate))
- Mark as New
- Bookmark
- Subscribe
- Mute
- Subscribe to RSS Feed
- Permalink
- Report Inappropriate Content
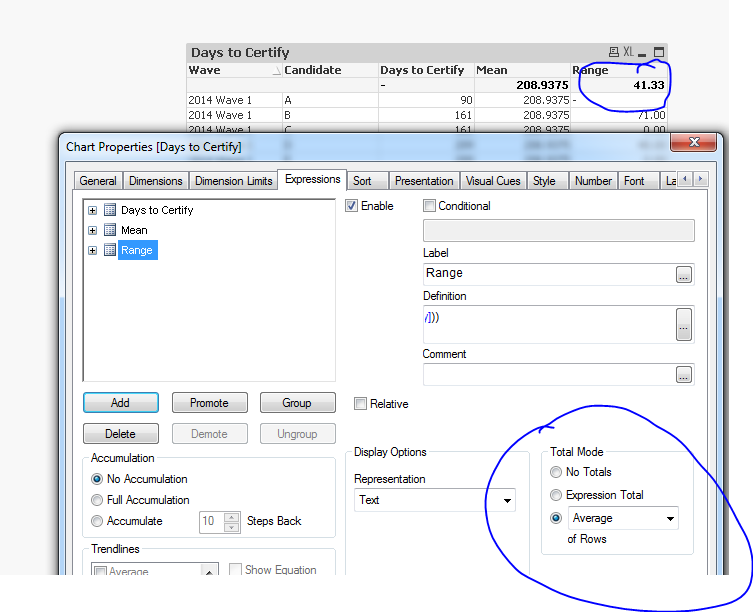
Thanks! What if I want to have the mean range have its own column just like my column 'Mean' does?
sunny_talwar
- Mark as New
- Bookmark
- Subscribe
- Mute
- Subscribe to RSS Feed
- Permalink
- Report Inappropriate Content
Try this:
=If([Days to Certify] > 0, Avg(TOTAL Aggr(Fabs(interval(only({<Certified?={'Y'}>}[Certification Date])-only({<Certified?={'Y'}>}[Training Date]),'d')-
Above(total interval(only({<Certified?={'Y'}>}[Certification Date])-only({<Certified?={'Y'}>}[Training Date]),'d'))), Wave, Candidate)))
- Mark as New
- Bookmark
- Subscribe
- Mute
- Subscribe to RSS Feed
- Permalink
- Report Inappropriate Content
That worked perfectly. One more question. Can I make a line chart directly from this straight table, or do I have to reenter the information in the expressions of the line chart? I will be using a formula similar to this (data mean) + 3*(mean range)/1.128
sunny_talwar
- Mark as New
- Bookmark
- Subscribe
- Mute
- Subscribe to RSS Feed
- Permalink
- Report Inappropriate Content
I think you should be able to use this straight table (or a copy of this straight table) and move forward from there.