Unlock a world of possibilities! Login now and discover the exclusive benefits awaiting you.

- Qlik Community
- :
- All Forums
- :
- QlikView
- :
- Median/Average with Set Analysis
- Subscribe to RSS Feed
- Mark Topic as New
- Mark Topic as Read
- Float this Topic for Current User
- Bookmark
- Subscribe
- Mute
- Printer Friendly Page

- Mark as New
- Bookmark
- Subscribe
- Mute
- Subscribe to RSS Feed
- Permalink
- Report Inappropriate Content
Median/Average with Set Analysis
So here's my situation:
I have two charts.
A 7 day rolling:
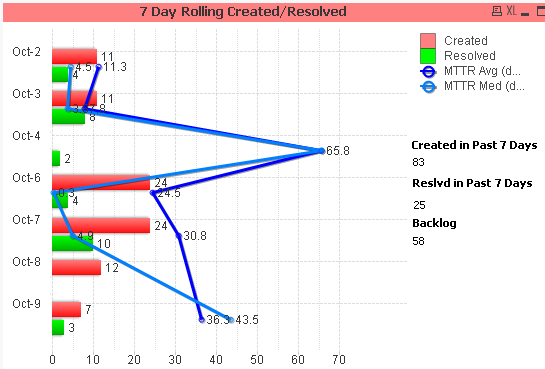
And a 30 day rolling. What is visible are created/resolved tickets and a daily average and daily median calculation (done using set analysis).
However when I try to calculate a 7 day average and median, the numbers are incorrect as compared to doing them by hand.
Here is the set analysis I'm using with my calculations as displayed:
Avg({1<[Project ID] = {10320}>} DaysToResolve)
Now I'm not entirely sure those numbers are right either as the average on Oct-2 on the chart is 11.3 and when I calculate by hand it comes out to 21.25.
How do I properly calculate the individual days, and a 7 day average for what is displayed?

 Gysbert_Wassena
- Mark as New
- Bookmark
- Subscribe
- Mute
- Subscribe to RSS Feed
- Permalink
- Report Inappropriate Content
Perhaps this document helps: Calculating rolling n-period totals, averages or other aggregations
talk is cheap, supply exceeds demand