Unlock a world of possibilities! Login now and discover the exclusive benefits awaiting you.

- Qlik Community
- :
- All Forums
- :
- QlikView
- :
- Moving Average Last 30 Days
- Subscribe to RSS Feed
- Mark Topic as New
- Mark Topic as Read
- Float this Topic for Current User
- Bookmark
- Subscribe
- Mute
- Printer Friendly Page

 vinicius_siquei
- Mark as New
- Bookmark
- Subscribe
- Mute
- Subscribe to RSS Feed
- Permalink
- Report Inappropriate Content
Moving Average Last 30 Days
Folks,
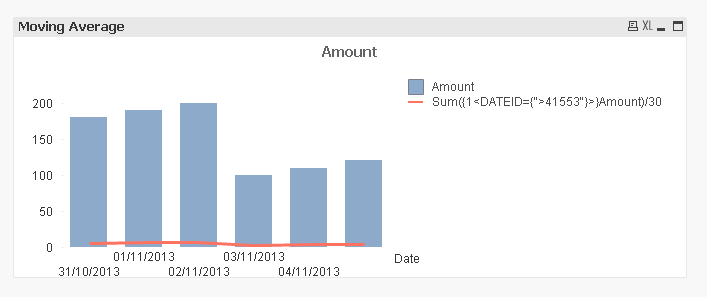
I have one chart just like the one on the image below. What I need to do is:
- Present only the last 5 days (It must change according to the period filtered)
- Display on the line, the Moving Average from the last 30 days.
Could anyone help me build the moving average ?
In case that displaying only the last 5 days could make things to hard, It okay to handle and have bigger periods. But I do need to have the Moving Average.
I'm attaching one sample file so we can try to do that.
Thanks in advance.
- Tags:
- moving+average
 Gysbert_Wassena
- Mark as New
- Bookmark
- Subscribe
- Mute
- Subscribe to RSS Feed
- Permalink
- Report Inappropriate Content
A practical way to create a moving average is using an AsOf table. See this document for an explanation and examples: Calculating rolling n-period totals, averages or other aggregations
talk is cheap, supply exceeds demand

 MK_QSL
- Mark as New
- Bookmark
- Subscribe
- Mute
- Subscribe to RSS Feed
- Permalink
- Report Inappropriate Content
Check Enclosed file...
