Unlock a world of possibilities! Login now and discover the exclusive benefits awaiting you.

- Qlik Community
- :
- All Forums
- :
- QlikView
- :
- Multiple Colors In 1 Single Bar Of A Bar Chart
- Subscribe to RSS Feed
- Mark Topic as New
- Mark Topic as Read
- Float this Topic for Current User
- Bookmark
- Subscribe
- Mute
- Printer Friendly Page

 s10157754
- Mark as New
- Bookmark
- Subscribe
- Mute
- Subscribe to RSS Feed
- Permalink
- Report Inappropriate Content
Multiple Colors In 1 Single Bar Of A Bar Chart
Dear Qlikview Experts,
I was thinking is it possible for Qlikview to achieve multiples colors in 1 single bar within a bar chart diagram? There is only 1 dimension and 1 expression. For example, sum(A) / sum(B).
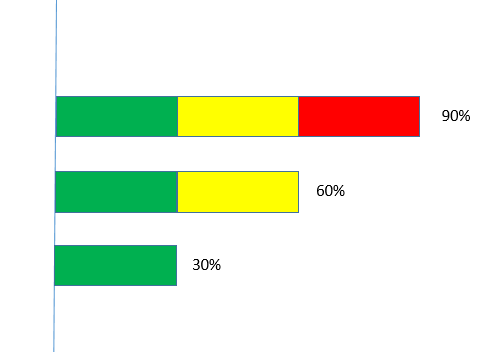
If the bar is 90%, then 0%-30% should be green, 31%-60% should be yellow and 61%-90% should be red. So is it possible for it to have different color representation for individual range of %?
Something like the picture shown below? Thanks for your help in advance!
Accepted Solutions

 MarcoWedel
- Mark as New
- Bookmark
- Subscribe
- Mute
- Subscribe to RSS Feed
- Permalink
- Report Inappropriate Content
Hi,
solutions might be either
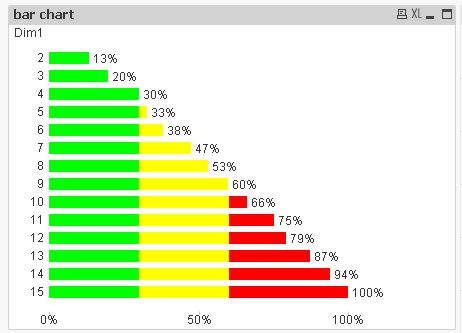
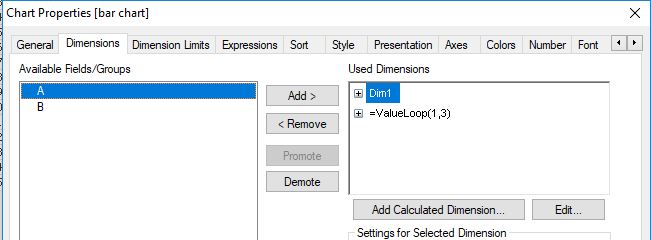
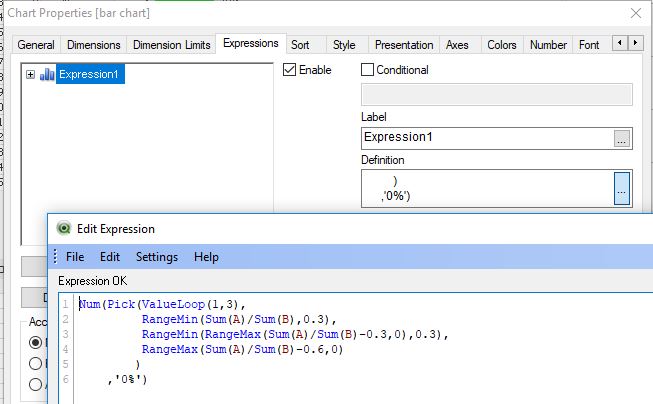
- a bar chart with additional synthetic dimension like this:
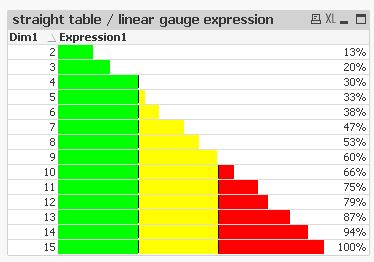
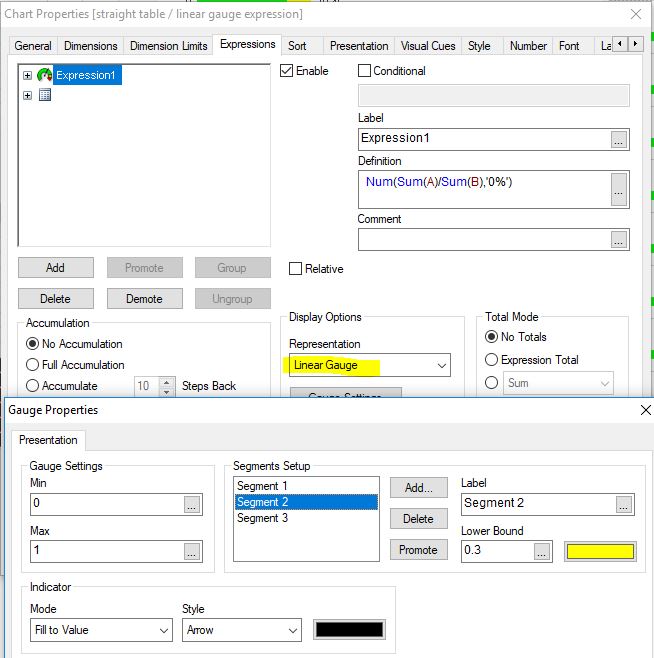
- or a straight table with linear gauge representation of your expression:
hope this helps
regards
Marco
 MK_QSL
- Mark as New
- Bookmark
- Subscribe
- Mute
- Subscribe to RSS Feed
- Permalink
- Report Inappropriate Content
In this case you have to use 3 expressions.
 ananyaghosh
- Mark as New
- Bookmark
- Subscribe
- Mute
- Subscribe to RSS Feed
- Permalink
- Report Inappropriate Content
HI,
Are you want to show the single bars with 3 different colors? or at different bars with different colors?
Thank,
Sandip
s10157754
- Mark as New
- Bookmark
- Subscribe
- Mute
- Subscribe to RSS Feed
- Permalink
- Report Inappropriate Content
Dear Kachhia,
Sorry for the late reply. I only have 1 expression, so I was looking for some functions there are able to display different colors for individual range of %.
Best Regards
s10157754
- Mark as New
- Bookmark
- Subscribe
- Mute
- Subscribe to RSS Feed
- Permalink
- Report Inappropriate Content
Dear Sandip,
Sorry for the late reply, I was looking for a way to show the single bar with 3 different colors. 
Best Regards

- Mark as New
- Bookmark
- Subscribe
- Mute
- Subscribe to RSS Feed
- Permalink
- Report Inappropriate Content
Yes, For single expression copy three times to get 3 different colors in single Graph
MarcoWedel
- Mark as New
- Bookmark
- Subscribe
- Mute
- Subscribe to RSS Feed
- Permalink
- Report Inappropriate Content
Hi,
solutions might be either
- a bar chart with additional synthetic dimension like this:
- or a straight table with linear gauge representation of your expression:
hope this helps
regards
Marco
s10157754
- Mark as New
- Bookmark
- Subscribe
- Mute
- Subscribe to RSS Feed
- Permalink
- Report Inappropriate Content
Dear Marco,
Thank you so much for the solution and it works perfectly for me!
Best Regards
QianNing
