Unlock a world of possibilities! Login now and discover the exclusive benefits awaiting you.

- Qlik Community
- :
- All Forums
- :
- QlikView
- :
- Multiple Colors in Graph
- Subscribe to RSS Feed
- Mark Topic as New
- Mark Topic as Read
- Float this Topic for Current User
- Bookmark
- Subscribe
- Mute
- Printer Friendly Page

 cristian_av
- Mark as New
- Bookmark
- Subscribe
- Mute
- Subscribe to RSS Feed
- Permalink
- Report Inappropriate Content
Multiple Colors in Graph
Hi
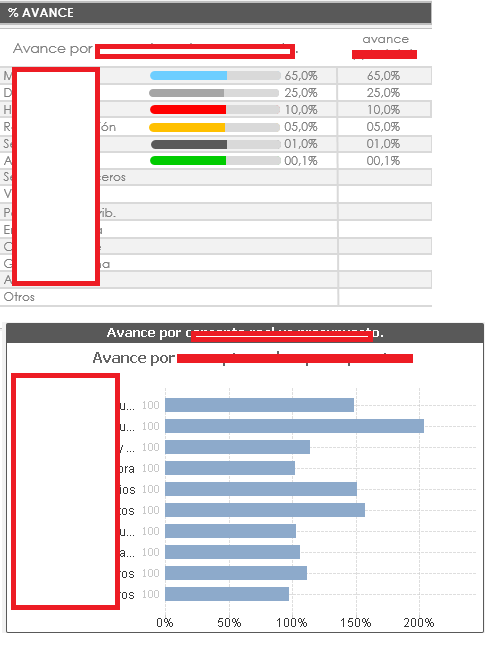
I need to build a graph like the first one. What I've done so far is like the second graph. I'm having two troubles:
a) How can I set multiple colors in the graph? I know how to put different colors depending on value, but I can't find a way to set color based on position (1st, 2nd, 3rd and so on...)
b) Is there any way I can put this "Graph" inline mixed with a table, like the one shown below?
BTW: There are two expressions in the graph(one for bars, another for table), they have the same value because is just an example.
Thanks!!
Accepted Solutions

 krishnacbe
- Mark as New
- Bookmark
- Subscribe
- Mute
- Subscribe to RSS Feed
- Permalink
- Report Inappropriate Content

 marcus_sommer
- Mark as New
- Bookmark
- Subscribe
- Mute
- Subscribe to RSS Feed
- Permalink
- Report Inappropriate Content
You could use: color(rowno()) to get the colors like they are defined within the color-tab from your chart.
- Marcus
krishnacbe
- Mark as New
- Bookmark
- Subscribe
- Mute
- Subscribe to RSS Feed
- Permalink
- Report Inappropriate Content
Hi,
You need to enable multicolor in the Color Tab.
krishnacbe
- Mark as New
- Bookmark
- Subscribe
- Mute
- Subscribe to RSS Feed
- Permalink
- Report Inappropriate Content
Define the colors in the Color tab as similar to the colors in the first graph
cristian_av
- Mark as New
- Bookmark
- Subscribe
- Mute
- Subscribe to RSS Feed
- Permalink
- Report Inappropriate Content
It appears disables. Do you know why?
cristian_av
- Mark as New
- Bookmark
- Subscribe
- Mute
- Subscribe to RSS Feed
- Permalink
- Report Inappropriate Content
It has two expressions. I've deleted one, enabled multicolor and then added the second one. Solved!
