Unlock a world of possibilities! Login now and discover the exclusive benefits awaiting you.

- Qlik Community
- :
- All Forums
- :
- QlikView
- :
- Multiple Dimensions with Multiple Measures?
- Subscribe to RSS Feed
- Mark Topic as New
- Mark Topic as Read
- Float this Topic for Current User
- Bookmark
- Subscribe
- Mute
- Printer Friendly Page

- Mark as New
- Bookmark
- Subscribe
- Mute
- Subscribe to RSS Feed
- Permalink
- Report Inappropriate Content
Multiple Dimensions with Multiple Measures?
Hi, I'm new to QlikView. Can anyone advise me on grouping the following data so that it can be displayed in a line chart?
I'm pulling in data from an SQL database with two dimension columns; PublishDate (the datetime that the data was published) and ForecastDate (the datetime that the data refers too). This is followed by various decimal columns.
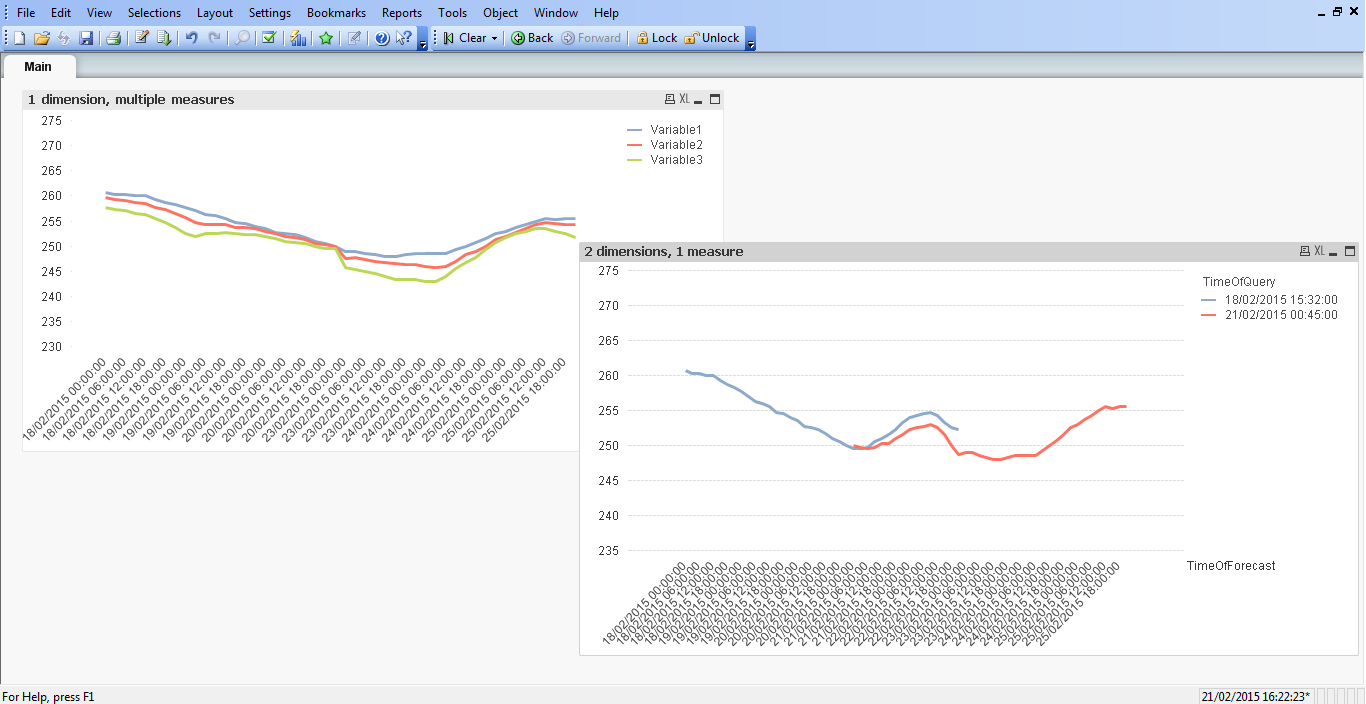
I can display one measure with two dimensions; the measure is grouped by PublishDate and plotted along ForecastDate as separate overlapping lines.
Or multiple measures with one dimension (without using an aggregation); where the overlapping values of ForecastDate get chopped out. In the image below this is between the 21st and 23rd.
Is there a way to allow a measure to have two distinct values plotted separately using the PublishDate to group the data? Or should I think about re-structuring the database or loading it differently?

 marcus_sommer
- Mark as New
- Bookmark
- Subscribe
- Mute
- Subscribe to RSS Feed
- Permalink
- Report Inappropriate Content
Have a look on the possibility to group several different dimensions into cyclic or drill groups and/or to group expressions into expression groups.
- Marcus
- Mark as New
- Bookmark
- Subscribe
- Mute
- Subscribe to RSS Feed
- Permalink
- Report Inappropriate Content
Thanks for the tip. I was testing multiple platforms and decided to go for a different one, but this question might point others in the right direction.