Unlock a world of possibilities! Login now and discover the exclusive benefits awaiting you.

- Qlik Community
- :
- All Forums
- :
- QlikView
- :
- Need Help
- Subscribe to RSS Feed
- Mark Topic as New
- Mark Topic as Read
- Float this Topic for Current User
- Bookmark
- Subscribe
- Mute
- Printer Friendly Page

 Nagaraju_KCS
- Mark as New
- Bookmark
- Subscribe
- Mute
- Subscribe to RSS Feed
- Permalink
- Report Inappropriate Content
Need Help
Hi All,
I have one requirement..
I have 3 bucket in my table,
Field1 Field2 Field3
0-10 - 0-10
10-20 10-20 10-20
20-30 20-30 20-30
30-40 - 30-40
- 40-50 -
- 50-60 -
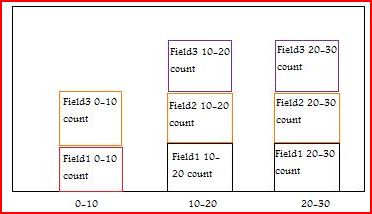
I want to show bucket wise count in Stacked bars...
Suppose i have 0-10 i want show in stacked bar only related 0-10 for three fields count(Field1, Field2 and Field3).
My X-Axis should be 0-10, 10-20, 20-30, 30-40,40-50,50-60
and stacked BAR (Suppose 0-10, here i have to show only Filed1 and Field3 count in my Bar.. because Field2 0-10 i don't have in my bucket )
My output should be like this...and so on .... like 30-40,40-50,50-60
Thanks in Advance...
- Tags:
- new_to_qlikview
- « Previous Replies
-
- 1
- 2
- Next Replies »
Accepted Solutions

 petter
- Mark as New
- Bookmark
- Subscribe
- Mute
- Subscribe to RSS Feed
- Permalink
- Report Inappropriate Content
I think I finally got it ... have a look:

Had do do a CROSSTABLE(....) LOAD to get the data in a table format that would work for me:

 jonathandienst
- Mark as New
- Bookmark
- Subscribe
- Mute
- Subscribe to RSS Feed
- Permalink
- Report Inappropriate Content
I have no idea what you are trying to do. I suggest that you post a sample qvw with representative data and more detail about exactly what you want to create. Screenshots are of very limited value.

 marcus_sommer
- Mark as New
- Bookmark
- Subscribe
- Mute
- Subscribe to RSS Feed
- Permalink
- Report Inappropriate Content
I think you will rather need another data-structure which looks like:
ClusterSize Amount
0-10 n
0-10 n
10-20 n
....
transformed per crosstable-load: The Crosstable Load
- Marcus
petter
- Mark as New
- Bookmark
- Subscribe
- Mute
- Subscribe to RSS Feed
- Permalink
- Report Inappropriate Content
Is it something like this you are looking for:

Nagaraju_KCS
- Mark as New
- Bookmark
- Subscribe
- Mute
- Subscribe to RSS Feed
- Permalink
- Report Inappropriate Content
Hi Petter,
I am sorry, I am confusing with how to explain my requirement..
Example:
I have one table, 2 buckets.
Like Bucket1 and Bucket2
Suppose Bucket1=0-10, 10-20, 30-40
Bucket2=10-20,20-30,30-40,50-60
Now, Barchart dimension should be in X-Axis
i want to show 0-10,10-20,20-30,30-40,50-60
I want to show Stacked bar..
Suppose 0-10 bar i want to show count only (0-10 Bucket1 count and 0-10 Bucket2 count)
Now Hope you Understand...
Nagaraju_KCS
- Mark as New
- Bookmark
- Subscribe
- Mute
- Subscribe to RSS Feed
- Permalink
- Report Inappropriate Content
Please anyone help me.............
petter
- Mark as New
- Bookmark
- Subscribe
- Mute
- Subscribe to RSS Feed
- Permalink
- Report Inappropriate Content
More like this perhaps?

Nagaraju_KCS
- Mark as New
- Bookmark
- Subscribe
- Mute
- Subscribe to RSS Feed
- Permalink
- Report Inappropriate Content
HI Petter,
PFA,
petter
- Mark as New
- Bookmark
- Subscribe
- Mute
- Subscribe to RSS Feed
- Permalink
- Report Inappropriate Content
What does the data in your table mean? What is Mtng_Time_Bucket and what is TIME_Bucket?
petter
- Mark as New
- Bookmark
- Subscribe
- Mute
- Subscribe to RSS Feed
- Permalink
- Report Inappropriate Content
I think I finally got it ... have a look:
Had do do a CROSSTABLE(....) LOAD to get the data in a table format that would work for me:

- « Previous Replies
-
- 1
- 2
- Next Replies »