Unlock a world of possibilities! Login now and discover the exclusive benefits awaiting you.

- Qlik Community
- :
- All Forums
- :
- QlikView
- :
- Need to Define Money ranges dynamically?
- Subscribe to RSS Feed
- Mark Topic as New
- Mark Topic as Read
- Float this Topic for Current User
- Bookmark
- Subscribe
- Mute
- Printer Friendly Page

- Mark as New
- Bookmark
- Subscribe
- Mute
- Subscribe to RSS Feed
- Permalink
- Report Inappropriate Content
Need to Define Money ranges dynamically?
HI All,
i have bar chart and straight table
in bar chart I used the dimension as Month and expression as SUM(SALES)
my requirement is
display values on data points with defining money ranges like
SUM(SALES) / in this way to display
65235 / Rs 65.23 T
8423456 / Rs 84.23 L or 8.4 M
235436123/ Rs 23.54 C
LIke thisi his I need to display in expression for both Chart and Straight Table
Can any one help to solve
Thanks,
AR UMAMAHESH

 muthukumar77
- Mark as New
- Bookmark
- Subscribe
- Mute
- Subscribe to RSS Feed
- Permalink
- Report Inappropriate Content
Hi,
I hope it will be helpful for you.
PFA

 MarcoWedel
- Mark as New
- Bookmark
- Subscribe
- Mute
- Subscribe to RSS Feed
- Permalink
- Report Inappropriate Content
- Mark as New
- Bookmark
- Subscribe
- Mute
- Subscribe to RSS Feed
- Permalink
- Report Inappropriate Content
hi muthu,
could you please provide the logic, because I don't have license edition, here we use personal edition.
thanks,
AR UMAMAHESH
- Mark as New
- Bookmark
- Subscribe
- Mute
- Subscribe to RSS Feed
- Permalink
- Report Inappropriate Content
hi macro,
i did my requirement in text object. It's working fine, when comes to chart that formula was not working. I Need to give sepetate formula in charts.
THanks for your help
muthukumar77
- Mark as New
- Bookmark
- Subscribe
- Mute
- Subscribe to RSS Feed
- Permalink
- Report Inappropriate Content
Hi,
Logic:
=if(len(sum(sales))<6,sum(sales)/1000 & ' T',
if(len(sum(sales))=6 or len(sum(sales))=7 or len(sum(sales))=8,sum(sales)/100000 & ' L',
if(len(sum(sales))>8,sum(sales)/10000000 & ' C')))
- Mark as New
- Bookmark
- Subscribe
- Mute
- Subscribe to RSS Feed
- Permalink
- Report Inappropriate Content
Hi Muthu,
I got my requirement in text object, but i need to display in bar chart and straight table.
Below i attached one image with actual output and expected output.
I used below Dimension,Expression to get the bar and straight table (Display Only Last 3 Months data)
Dimension: MonthName
Expression:
Sum({<OrderDate={">=$(=MonthStart(OrderDate,-3) <=$(=Max(OrderDate)"}>}Sales)
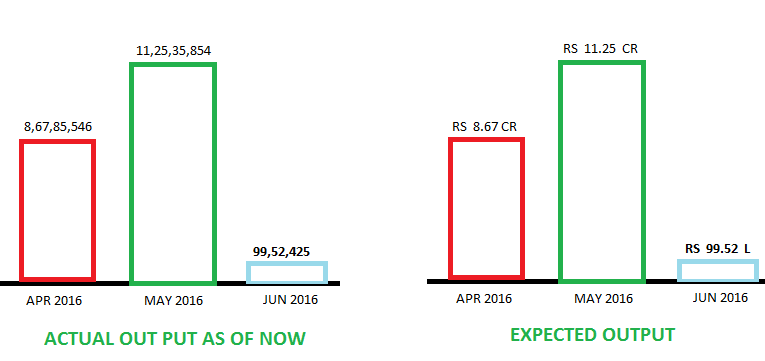
If i go for the selection, the text value CR,L will change as per the selected value, I am getting in Text Object but i failed to get in BAR and STRAIGHT table.
Please help me to solve
Thanks,
AR UMAMAHESH
- Mark as New
- Bookmark
- Subscribe
- Mute
- Subscribe to RSS Feed
- Permalink
- Report Inappropriate Content
Hi ALL,
I got my requirement in text object, but i need to display in bar chart and straight table.
Below i attached one image with actual output and expected output.
I used below Dimension,Expression to get the bar and straight table (Display Only Last 3 Months data)
Dimension: MonthName
Expression:
Sum({<OrderDate={">=$(=MonthStart(OrderDate,-3) <=$(=Max(OrderDate)"}>}Sales)
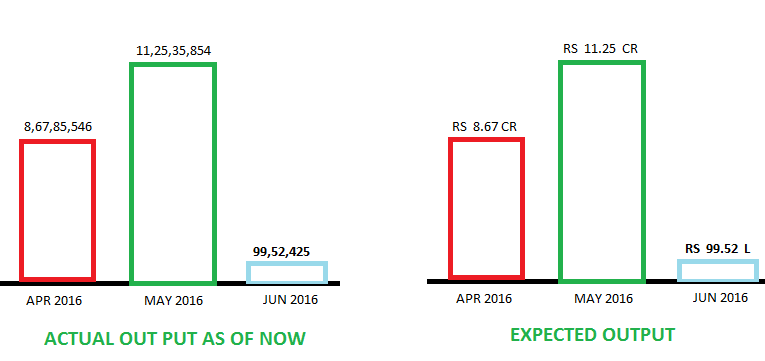
If i go for the selection, the text value CR,L will change as per the selected value, I am getting in Text Object but i failed to get in BAR and STRAIGHT table.
Please help me to solve
Thanks,
AR UMAMAHESH