Unlock a world of possibilities! Login now and discover the exclusive benefits awaiting you.

- Qlik Community
- :
- All Forums
- :
- QlikView
- :
- Normal Distribution chart
Options
- Subscribe to RSS Feed
- Mark Topic as New
- Mark Topic as Read
- Float this Topic for Current User
- Bookmark
- Subscribe
- Mute
- Printer Friendly Page
Turn on suggestions
Auto-suggest helps you quickly narrow down your search results by suggesting possible matches as you type.
Showing results for

 spyrosd80
Contributor II
2013-06-03
10:35 AM
- Mark as New
- Bookmark
- Subscribe
- Mute
- Subscribe to RSS Feed
- Permalink
- Report Inappropriate Content
Normal Distribution chart
Hello to everyone.
I am trying to create a Normal Distribution line chart from a given pool of numbers.(sample measurements from a product that comes out a production line).
I believe that I have to create a column with numbers ascending between the Min and Max and use the normdist function for each value to create the graph
The graph should look like the following:
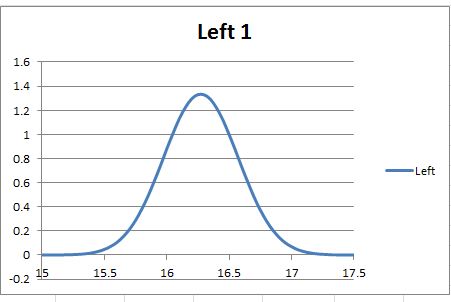
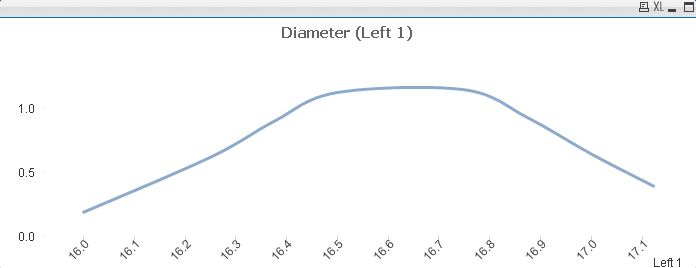
However I haven't been able to create it so far. I get something like the following:
1,473 Views
0 Replies
