Unlock a world of possibilities! Login now and discover the exclusive benefits awaiting you.

- Qlik Community
- :
- All Forums
- :
- QlikView
- :
- Percentage Issue in If Else Condition
- Subscribe to RSS Feed
- Mark Topic as New
- Mark Topic as Read
- Float this Topic for Current User
- Bookmark
- Subscribe
- Mute
- Printer Friendly Page

 waqasshah
- Mark as New
- Bookmark
- Subscribe
- Mute
- Subscribe to RSS Feed
- Permalink
- Report Inappropriate Content
Percentage Issue in If Else Condition
Hi Guys,
I am trying to calculate the percentage value if specific criteria meets. I don't know why If Else condition is not working . . The charts will be my proposed output. Please review the attached screenshots. Please help.
Kind Regards
Waqas Shah


- « Previous Replies
-
- 1
- 2
- Next Replies »
Accepted Solutions

 timpoismans
- Mark as New
- Bookmark
- Subscribe
- Mute
- Subscribe to RSS Feed
- Permalink
- Report Inappropriate Content
In the above screenshot, I am simple making use of a bar graph and a selection field of Specialty.
No use of Set Analysis.
I'm afraid I can't share the example file, as I'm using Qlik Sense (.qvf file vs .qvw file)
The solution works on QlikView and Qlik Sense though.
Steps to undertake:
- Create a selection field of Specialty.
- Make a bar graph
- Dimension is Financial Year
- Measure is: Sum(DNA)/Sum(total<DNASpecialty,[Financial Year]>DNATotal)
- Finished.
You can now use the selection field to switch between the specialties.
If your issue is resolved, please mark the correct answer and/or any helpful answers. Thanks.

 joseph_eftamand
- Mark as New
- Bookmark
- Subscribe
- Mute
- Subscribe to RSS Feed
- Permalink
- Report Inappropriate Content
Have you tried using set analysis?
Sum({<Specialty = {'SpecialtyName'} >} SNA) / Sum({<Specialty = {'SpecialtyName'} >} Total SNA)
Let me know if that works for you.
Thanks,
Joseph
waqasshah
- Mark as New
- Bookmark
- Subscribe
- Mute
- Subscribe to RSS Feed
- Permalink
- Report Inappropriate Content
Thanks for your reply. No I have not use set Analysis before. I will try this but do you have any idea what's wrong with my script?
Surely I will try set analysis
regards
Waqas Shah
joseph_eftamand
- Mark as New
- Bookmark
- Subscribe
- Mute
- Subscribe to RSS Feed
- Permalink
- Report Inappropriate Content
The SNA field is underlined indicating QV may not recognise the field. Also what tis the field TotalSNA?
waqasshah
- Mark as New
- Bookmark
- Subscribe
- Mute
- Subscribe to RSS Feed
- Permalink
- Report Inappropriate Content
I just change the names .. Please have a look now with your set analysis.. but no luck,,, please have a look now
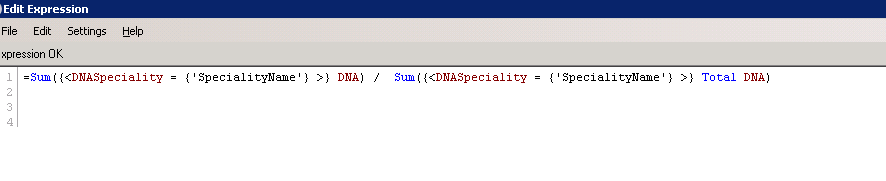
joseph_eftamand
- Mark as New
- Bookmark
- Subscribe
- Mute
- Subscribe to RSS Feed
- Permalink
- Report Inappropriate Content
can you send a small sample of data to test?
waqasshah
- Mark as New
- Bookmark
- Subscribe
- Mute
- Subscribe to RSS Feed
- Permalink
- Report Inappropriate Content
I have attached sample data ..
timpoismans
- Mark as New
- Bookmark
- Subscribe
- Mute
- Subscribe to RSS Feed
- Permalink
- Report Inappropriate Content
Based on your sample data out of Excel:

On the left is the data load, on the right the percentage.
I don't understand the relation between the DNA field and DNA total though.
waqasshah
- Mark as New
- Bookmark
- Subscribe
- Mute
- Subscribe to RSS Feed
- Permalink
- Report Inappropriate Content
Thanks for your reply. Please review the updated dataset.
DNA means Did Not Attend
DNATotal = DNA + Attends
Like We have DNA Speciality called Surgery e.g. . we need to know in the financial year of 2017/2018 what were the percentage of patents who did not attend their clinicians. I hope it makes sense.
Kind Regards
Waqas Shah
timpoismans
- Mark as New
- Bookmark
- Subscribe
- Mute
- Subscribe to RSS Feed
- Permalink
- Report Inappropriate Content
Makes sense.
Please take a look at the image below if this is the desired result:

Loaded data is on the left.
Table on the right gives you the percentage of DNA for that specialty in the financial year.

- « Previous Replies
-
- 1
- 2
- Next Replies »