Unlock a world of possibilities! Login now and discover the exclusive benefits awaiting you.

- Qlik Community
- :
- All Forums
- :
- QlikView
- :
- Percentage per dimension in line chart
- Subscribe to RSS Feed
- Mark Topic as New
- Mark Topic as Read
- Float this Topic for Current User
- Bookmark
- Subscribe
- Mute
- Printer Friendly Page

- Mark as New
- Bookmark
- Subscribe
- Mute
- Subscribe to RSS Feed
- Permalink
- Report Inappropriate Content
Percentage per dimension in line chart
Hi to everybody
I try hardly to solve the following problem. I would like to normalize values of three characteristic of an attribute.
Assume having a simple database describing
- how much Customer A, B and C
- bought in Quarter 1, 2, 3 and 4
(simple table with attributes Quarter, Customer, Amount)
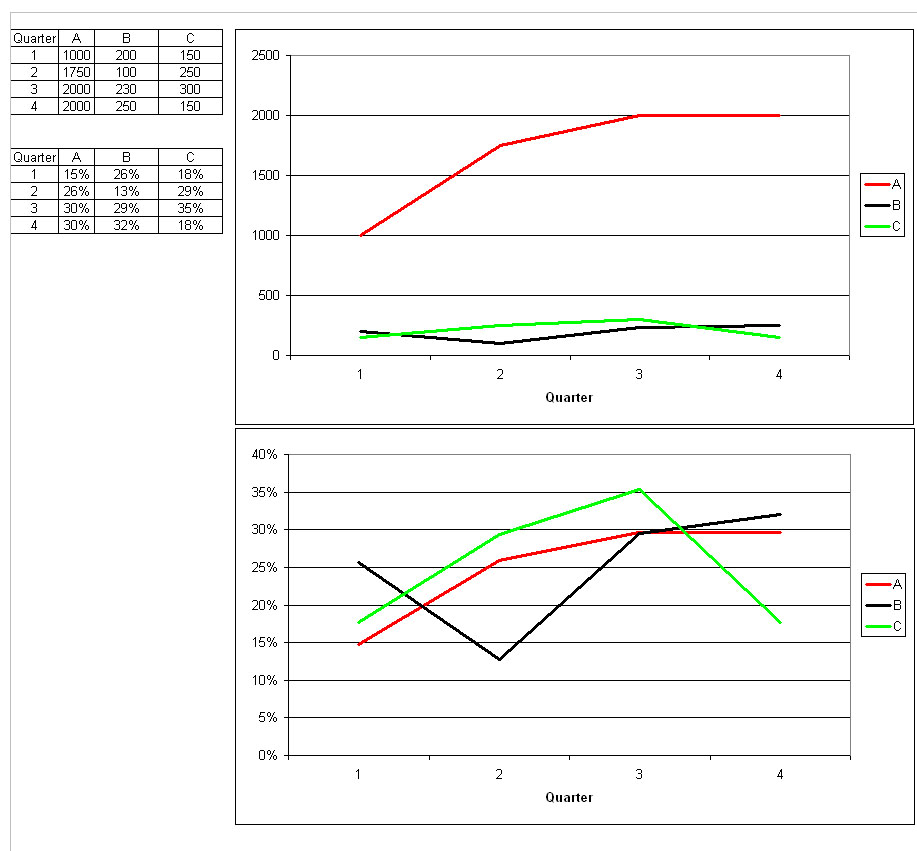
I would like to figure out if they have similar buying patterns regarding seasons. In chart one below this is hardly possible because customer A buys much more than the other ones.
In the second chart it is better possible to see if the have quite similar buying behaviour over time or not. Each client total sum is normalized to 100% and distributed over the four quarters.
QUESTION: How is the formula / expression (in qlikview) for the second chart?
The following expression is quite close to the expected result; but not yet what I would like to have.
sum(Amount) / sum(Total <Customer> Amount)
Any ideas?
Thanks a lot in advance
Luk
Accepted Solutions

 nagaiank
- Mark as New
- Bookmark
- Subscribe
- Mute
- Subscribe to RSS Feed
- Permalink
- Report Inappropriate Content
You may load the data using the following script:
Data:
LOAD * INLINE [
Cust, Q, Val
A, 1, 1000
A, 2, 1750
A, 3, 2000
A, 4, 2000
B, 1, 200
B, 2, 100
B, 3, 230
B, 4, 250
C, 1, 150
C, 2, 250
C, 3, 300
C, 4, 150
];
The dimensions and expression for the first multi-line chart are:
Dimension 1 : Q
Dimension 2 : Cust
Expression : Sum(Val)
The dimensions and expressions for the second multi-line chart are:
Dimension 1 : Q
Dimension 2 : Cust
Expression : Sum(Val)/Sum(TOTAL<Cust> Val)
Sample qvw file is attached.
nagaiank
- Mark as New
- Bookmark
- Subscribe
- Mute
- Subscribe to RSS Feed
- Permalink
- Report Inappropriate Content
You may load the data using the following script:
Data:
LOAD * INLINE [
Cust, Q, Val
A, 1, 1000
A, 2, 1750
A, 3, 2000
A, 4, 2000
B, 1, 200
B, 2, 100
B, 3, 230
B, 4, 250
C, 1, 150
C, 2, 250
C, 3, 300
C, 4, 150
];
The dimensions and expression for the first multi-line chart are:
Dimension 1 : Q
Dimension 2 : Cust
Expression : Sum(Val)
The dimensions and expressions for the second multi-line chart are:
Dimension 1 : Q
Dimension 2 : Cust
Expression : Sum(Val)/Sum(TOTAL<Cust> Val)
Sample qvw file is attached.