Unlock a world of possibilities! Login now and discover the exclusive benefits awaiting you.

- Qlik Community
- :
- All Forums
- :
- QlikView
- :
- Period comparison based on the backlog
- Subscribe to RSS Feed
- Mark Topic as New
- Mark Topic as Read
- Float this Topic for Current User
- Bookmark
- Subscribe
- Mute
- Printer Friendly Page

- Mark as New
- Bookmark
- Subscribe
- Mute
- Subscribe to RSS Feed
- Permalink
- Report Inappropriate Content
Period comparison based on the backlog
Hello All!
Need some help.
I have expression that calculates non-closed requests:
=RangeSum(Above (Count(DISTINCT {$< DateType={'WorkItemDeadline'} >} %WorkItemUID)
-
Count(DISTINCT {$<DateType={'ActualFinish'} >} %WorkItemUID), 0, RowNo()))
It's working fine on the diagram with "Month-Year" dimension (for the entire period):
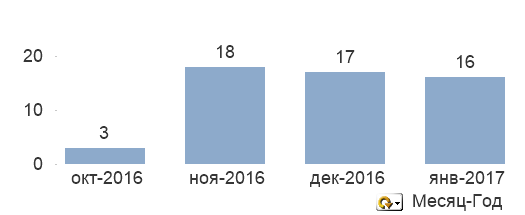
But i can't figure out how to display my backlog categorized by the same periods. For example, months of the current year vs previous year.
When i change dimension to the "Month" and add 2 expressions for the years:
2017:
=rangesum(Above (Count(DISTINCT {$< DateType={'WorkItemDeadline'}, Year= {2017} >} %WorkItemUID)
-
Count(DISTINCT {$<DateType={'ActualFinish'}, Year = {2017} >} %WorkItemUID), 0, RowNo()))
2016:
=rangesum(Above (Count(DISTINCT {$< DateType={'WorkItemDeadline'}, Year= {"<2017"} >} %WorkItemUID)
-
Count(DISTINCT {$<DateType={'ActualFinish'}, Year = {"<2017"} >} %WorkItemUID), 0, RowNo()))
i have uncorrect result:
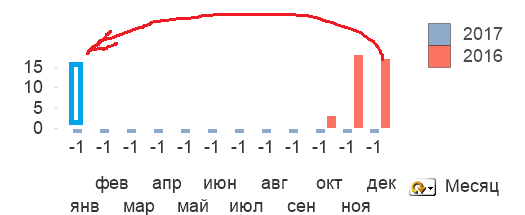
Сan anyone explain how to compare backlogs in different period? Backlog for 2017 year must include previous periods backlog. Thank you.
Accepted Solutions

 sunny_talwar
- Mark as New
- Bookmark
- Subscribe
- Mute
- Subscribe to RSS Feed
- Permalink
- Report Inappropriate Content
Do you mean 15 or 16 for Jan 2017? If its 16, then try this
=Aggr((RangeSum(Above(TOTAL Count(DISTINCT {$< DateType={'WorkItemDeadline'}>} %WorkItemUID)
-
Count(DISTINCT {$< DateType={'ActualFinish'} >} %WorkItemUID), 0, RowNo(TOTAL)))) * Avg({<Year = {2017}>} 1), [Month-Year], Month)
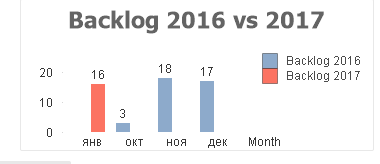
I thought it would be 16 because it 2016 values match with 2016 values in the above chart, so I thought 2017 values should also match
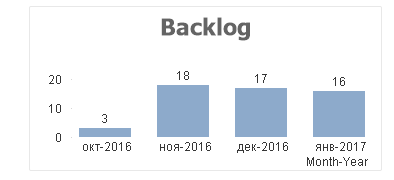
But I could be wrong and might not have understood the logic. Feel free to point out if you think I have not understood your question clearly 
Best,
Sunny
sunny_talwar
- Mark as New
- Bookmark
- Subscribe
- Mute
- Subscribe to RSS Feed
- Permalink
- Report Inappropriate Content
Might be easier to help if you share a sample as we might need to play around to help better. Also share the numeric output you are looking to get
- Mark as New
- Bookmark
- Subscribe
- Mute
- Subscribe to RSS Feed
- Permalink
- Report Inappropriate Content
Sunny, thank you for reply,
i have been attached qvw.
There is a list of requests with 3 dates (creation, completion and deadline).
I accumulate general backlog (requests to be resolved) by rangesum function (top diagram).
On the bottom diagram I need to show backlog 2017 vs 2016 years. Dimension = Month Name.
First month (January in 2017) would be 15, i.e. include previous period backlog (December 2016) and include current month (-1).
sunny_talwar
- Mark as New
- Bookmark
- Subscribe
- Mute
- Subscribe to RSS Feed
- Permalink
- Report Inappropriate Content
Do you mean 15 or 16 for Jan 2017? If its 16, then try this
=Aggr((RangeSum(Above(TOTAL Count(DISTINCT {$< DateType={'WorkItemDeadline'}>} %WorkItemUID)
-
Count(DISTINCT {$< DateType={'ActualFinish'} >} %WorkItemUID), 0, RowNo(TOTAL)))) * Avg({<Year = {2017}>} 1), [Month-Year], Month)
I thought it would be 16 because it 2016 values match with 2016 values in the above chart, so I thought 2017 values should also match
But I could be wrong and might not have understood the logic. Feel free to point out if you think I have not understood your question clearly
Best,
Sunny
- Mark as New
- Bookmark
- Subscribe
- Mute
- Subscribe to RSS Feed
- Permalink
- Report Inappropriate Content
Sunny, of course 16 for January. Thank you so much Looks like exactly what i need.