Unlock a world of possibilities! Login now and discover the exclusive benefits awaiting you.
Announcements
Q&A with Qlik - Qlik Cloud Migration: Questions about migrating to Qlik Cloud? Catch the latest replay!
- Qlik Community
- :
- All Forums
- :
- QlikView
- :
- Pie chart with Parts and Total
Options
- Subscribe to RSS Feed
- Mark Topic as New
- Mark Topic as Read
- Float this Topic for Current User
- Bookmark
- Subscribe
- Mute
- Printer Friendly Page
Turn on suggestions
Auto-suggest helps you quickly narrow down your search results by suggesting possible matches as you type.
Showing results for
Anonymous
Not applicable
2018-06-14
12:25 PM
- Mark as New
- Bookmark
- Subscribe
- Mute
- Subscribe to RSS Feed
- Permalink
- Report Inappropriate Content
Pie chart with Parts and Total
Let's say if I had a QVD:
| X | Y | Z | ALL | |
|---|---|---|---|---|
| A | 4 | 6 | 4 | 14 |
| B | 7 | 10 | 3 | 20 |
| C | 1 | 0 | 2 | 3 |
| D | 20 | 4 | 5 | 29 |
| E | 0 | 6 | 7 | 13 |
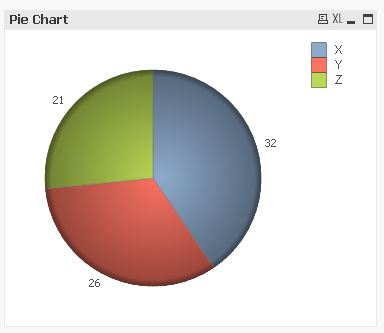
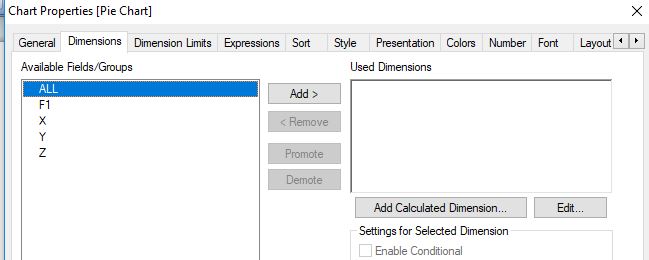
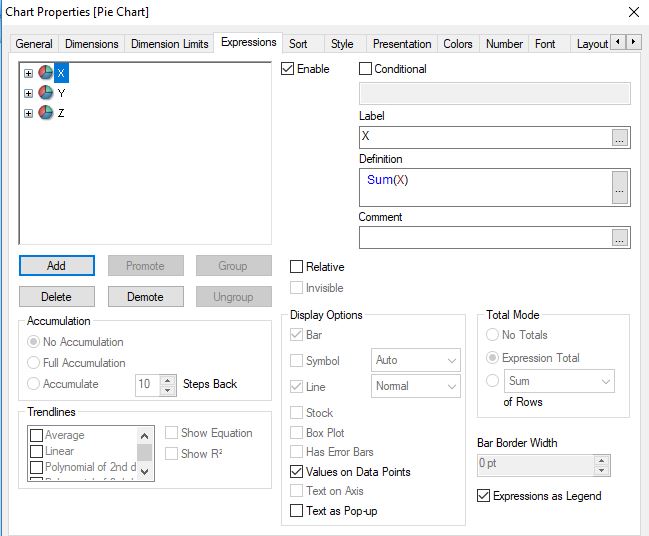
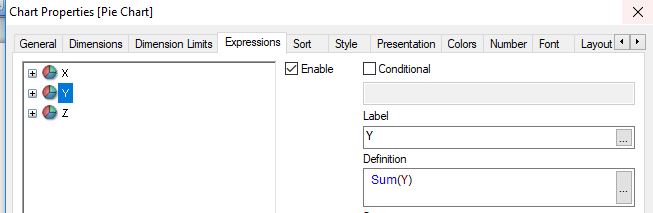
I want to create a Pie Chart that show how much X, Y and Z represents the ALL field. All the examples that I see, exist a field set in dimension with the values that become the legend of the chart, but in this case the legend has to be X, Y and Z. What I put in dimension and the expression?
1,321 Views
1 Solution
Accepted Solutions
MVP
2018-06-14
04:44 PM
- Mark as New
- Bookmark
- Subscribe
- Mute
- Subscribe to RSS Feed
- Permalink
- Report Inappropriate Content
3 Replies
MVP
2018-06-14
04:44 PM
- Mark as New
- Bookmark
- Subscribe
- Mute
- Subscribe to RSS Feed
- Permalink
- Report Inappropriate Content
Hi,
one solution might be:
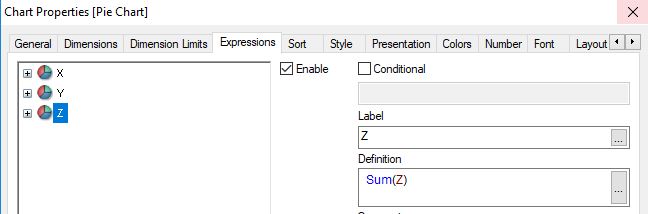
hope this helps
regards
Marco
Anonymous
Not applicable
2018-06-15
02:41 PM
Author
- Mark as New
- Bookmark
- Subscribe
- Mute
- Subscribe to RSS Feed
- Permalink
- Report Inappropriate Content
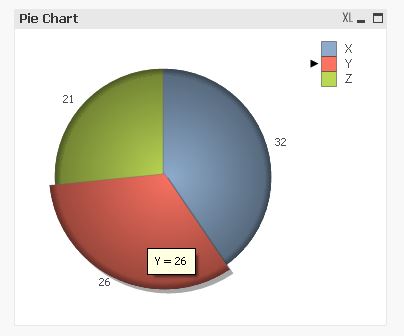
Why all the labels when you stand the mouse shows X, even in Y or Z values?
1,226 Views
MVP
2018-06-15
02:53 PM
- Mark as New
- Bookmark
- Subscribe
- Mute
- Subscribe to RSS Feed
- Permalink
- Report Inappropriate Content
I can't reproduce this behaviour:
1,226 Views