Unlock a world of possibilities! Login now and discover the exclusive benefits awaiting you.
- Qlik Community
- :
- All Forums
- :
- QlikView
- :
- Pivot Table Font Size
- Subscribe to RSS Feed
- Mark Topic as New
- Mark Topic as Read
- Float this Topic for Current User
- Bookmark
- Subscribe
- Mute
- Printer Friendly Page
- Mark as New
- Bookmark
- Subscribe
- Mute
- Subscribe to RSS Feed
- Permalink
- Report Inappropriate Content
Pivot Table Font Size
I have three dimensions in pivot table and two expressions..
Now i have sliced the last positioned dimension over expression
Now i want to change the size and colour of the data inside That last dimension
For e.g
name city total Amount
abcd shanghai 20
defg newyork 40
hijk newdelhi 60
Mnop shanghai 80
Now I have sliced it like this
name City shanghai newyork newdelhi
abcd 20
defg 40
hijk 60
Mnop 80
Now i want to change the font size and colour of only shanghai newyork and newdelhi
Help me Please!!!
- Tags:
- new_to_qlikview
- « Previous Replies
-
- 1
- 2
- Next Replies »
- Mark as New
- Bookmark
- Subscribe
- Mute
- Subscribe to RSS Feed
- Permalink
- Report Inappropriate Content
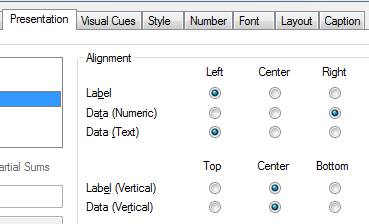
You can do this from Chart properties >> Presentation >> Alignment.
Regards
Anand
- Mark as New
- Bookmark
- Subscribe
- Mute
- Subscribe to RSS Feed
- Permalink
- Report Inappropriate Content
Thank you so Much Guys !!!!
- « Previous Replies
-
- 1
- 2
- Next Replies »