Unlock a world of possibilities! Login now and discover the exclusive benefits awaiting you.

- Qlik Community
- :
- All Forums
- :
- QlikView
- :
- Pivot table with complex aggregation
- Subscribe to RSS Feed
- Mark Topic as New
- Mark Topic as Read
- Float this Topic for Current User
- Bookmark
- Subscribe
- Mute
- Printer Friendly Page

- Mark as New
- Bookmark
- Subscribe
- Mute
- Subscribe to RSS Feed
- Permalink
- Report Inappropriate Content
Pivot table with complex aggregation
Hi everyone.
I need to make some defined view using (I think) Pivot table. Probably it should be done with aggr and rangesum functions but I can not figure out how to do it. Can anyone help?
So the initial conditions are: two dimensions and one measure.Dimensions are data-driven so there will be more than 4 columns/rows.
You can start from the table below:
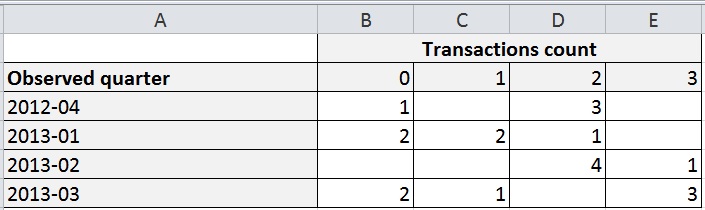
Dimensions names: Q, F. Measure is number of customers with defined number transactions in each quarter =count(L)
What I need now - is to make kind of aggregated count for each row:
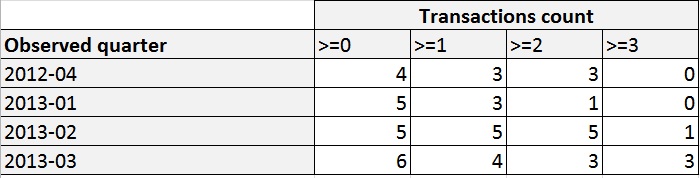
If you look at the first row:
first column we should see sum for all columns in a first row=1+0+3+0=4
second column=4 minus all previous columns values (1)=3
third column=4 minus all previous column values (1+0)=3
forth column=4 minus all previous column values (1+0+3)=0
So first row is 4-3-3-0.
Any ideas? Previously thank yoou for your help.